Nokia 2010 Annual Report Download - page 119
Download and view the complete annual report
Please find page 119 of the 2010 Nokia annual report below. You can navigate through the pages in the report by either clicking on the pages listed below, or by using the keyword search tool below to find specific information within the annual report.-
 1
1 -
2
-
3
-
4
-
5
-
6
-
7
-
8
-
9
-
10
-
11
-
12
-
13
-
14
-
15
-
16
-
17
-
18
-
19
-
20
-
21
-
22
-
23
-
24
-
25
-
26
-
27
-
28
-
29
-
30
-
31
-
32
-
33
-
34
-
35
-
36
-
37
-
38
-
39
-
40
-
41
-
42
-
43
-
44
-
45
-
46
-
47
-
48
-
49
-
50
-
51
-
52
-
53
-
54
-
55
-
56
-
57
-
58
-
59
-
60
-
61
-
62
-
63
-
64
-
65
-
66
-
67
-
68
-
69
-
70
-
71
-
72
-
73
-
74
-
75
-
76
-
77
-
78
-
79
-
80
-
81
-
82
-
83
-
84
-
85
-
86
-
87
-
88
-
89
-
90
-
91
-
92
-
93
-
94
-
95
-
96
-
97
-
98
-
99
-
100
-
101
-
102
-
103
-
104
-
105
-
106
-
107
-
108
-
 109
109 -
 110
110 -
 111
111 -
 112
112 -
 113
113 -
 114
114 -
 115
115 -
 116
116 -
 117
117 -
 118
118 -
 119
119 -
 120
120 -
 121
121 -
 122
122 -
 123
123 -
 124
124 -
 125
125 -
 126
126 -
 127
127 -
 128
128 -
 129
129 -
130
-
131
-
132
-
133
-
134
-
135
-
136
-
137
-
138
-
139
-
140
-
141
-
142
-
143
-
144
-
145
-
146
-
147
-
148
-
149
-
150
-
151
-
152
-
153
-
154
-
155
-
156
-
157
-
158
-
159
-
160
-
161
-
162
-
163
-
164
-
165
-
166
-
167
-
168
-
169
-
170
-
171
-
172
-
173
-
174
-
175
-
176
-
177
-
178
-
179
-
180
-
181
-
182
-
183
-
184
-
185
-
186
-
187
-
188
-
189
-
190
-
191
-
192
-
193
-
194
-
195
-
196
-
197
-
198
-
199
-
200
-
201
-
202
-
203
-
204
-
205
-
206
-
207
-
208
-
209
-
210
-
211
-
212
-
213
-
214
-
215
-
216
-
217
-
218
-
219
-
220
-
221
-
222
-
223
-
224
-
225
-
226
-
227
-
228
-
229
-
230
-
231
-
232
-
233
-
234
-
235
-
236
-
237
-
238
-
239
-
240
-
241
-
242
-
243
-
244
-
245
-
246
-
247
-
248
-
249
-
250
-
251
-
252
-
253
-
254
-
255
-
256
-
257
-
258
-
259
-
260
-
261
-
262
-
263
-
264
-
265
-
266
-
267
-
268
-
269
-
270
-
271
-
272
-
273
-
274
-
275
 |
 |
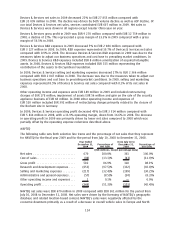
effective tax rate increased to 73.0% in 2009 compared with 21.8% in 2008, primarily due to the
nontax deductible impairment of Nokia Siemens Networks goodwill and certain Nokia Siemens
Network’s tax deductible temporary differences for which no deferred tax assets were recognized due
to uncertainty of utilization in these items. These were offset by the positive effect from the
development and outcome of various prior year items impacting Nokia taxes. In 2008, taxes included
the positive impact of EUR 128 million due to recognition of certain tax benefits from prior years.
Noncontrolling Interests
Noncontrolling shareholders’ interest in our subsidiaries’ losses totaled EUR 631 million in 2009
compared with noncontrolling shareholders’ interest in our subsidiaries’ losses of EUR 99 million in
2008. The change was primarily due to an increase in Nokia Siemens Networks’ losses.
Profit Attributable to Equity Holders of the Parent and Earnings per Share
Profit attributable to equity holders of the parent in 2009 totaled EUR 891 million compared with
EUR 3 988 million in 2008, representing a yearonyear decrease of 78% in 2008. Earnings per share
in 2009 decreased to EUR 0.24 (basic) and EUR 0.24 (diluted) compared with EUR 1.07 (basic) and
EUR 1.05 (diluted) in 2008.
5B. Liquidity and Capital Resources
At December 31, 2010, our cash and other liquid assets (bank and cash; availableforsale
investments, cash equivalents; availableforsale investments, liquid assets; and investments at fair
value through profit and loss, liquid assets) increased to EUR 12 275 million, compared with
EUR 8 873 million at December 31, 2009, primarily as a result of an increase in cash generated from
operations. At December 31, 2008, cash and other liquid assets totaled EUR 6 820 million.
At December 31, 2010, cash and cash equivalents (bank and cash and availableforsale investments,
cash equivalent) increased to EUR 7 592 million, compared with EUR 5 926 million at December 31,
2009. We hold our cash and cash equivalents predominantly in euro. Cash and cash equivalents
totaled EUR 5 548 million at December 31, 2008.
Net cash from operating activities was EUR 4 774 million in 2010, compared with EUR 3 247 million in
2009 and EUR 3 197 million in 2008. In 2010, net cash from operating activities increased primarily
due to a decrease in net working capital partially offset by an increase in other financial income and
expenses, net. In 2009, net cash from operating activities increased primarily due to a decrease in net
working capital and a decrease in income taxes paid partially offset by decreased profitability.
Net cash used in investing activities was EUR 2 421 million in 2010, compared with EUR 2 148 million
in 2009 and net cash from investing activities of EUR 2 905 million in 2008. Net cash used in
acquisitions of group companies, net of acquired cash, was EUR 110 million in 2010, compared with
EUR 29 million in 2009 and EUR 5 962 million in 2008 due to the acquisition of NAVTEQ. Cash flow
from investing activities in 2010 included purchases of current availableforsale investments, liquid
assets of EUR 8 573 million, compared with EUR 2 800 million in 2009 and EUR 669 million in 2008.
In 2010, net cash used in investing activities also included purchase of investments at fair value
through profit and loss, liquid assets of EUR 646 million, compared with EUR 695 million in 2009.
There were no additions to capitalized R&D expenses in 2010, compared with EUR 27 million addition
in 2009 and EUR 131 million addition in 2008.
Capital expenditures for 2010 were EUR 679 million, compared with EUR 531 million in 2009 and
EUR 889 million in 2008. Major items of capital expenditure included production lines, test equipment
and computer hardware used primarily in research and development, office and manufacturing
facilities as well as services and software related intangible assets.
118