Nokia 2010 Annual Report Download - page 264
Download and view the complete annual report
Please find page 264 of the 2010 Nokia annual report below. You can navigate through the pages in the report by either clicking on the pages listed below, or by using the keyword search tool below to find specific information within the annual report.-
 1
1 -
2
-
3
-
4
-
5
-
6
-
7
-
8
-
9
-
10
-
11
-
12
-
13
-
14
-
15
-
16
-
17
-
18
-
19
-
20
-
21
-
22
-
23
-
24
-
25
-
26
-
27
-
28
-
29
-
30
-
31
-
32
-
33
-
34
-
35
-
36
-
37
-
38
-
39
-
40
-
41
-
42
-
43
-
44
-
45
-
46
-
47
-
48
-
49
-
50
-
51
-
52
-
53
-
54
-
55
-
56
-
57
-
58
-
59
-
60
-
61
-
62
-
63
-
64
-
65
-
66
-
67
-
68
-
69
-
70
-
71
-
72
-
73
-
74
-
75
-
76
-
77
-
78
-
79
-
80
-
81
-
82
-
83
-
84
-
85
-
86
-
87
-
88
-
89
-
90
-
91
-
92
-
93
-
94
-
95
-
96
-
97
-
98
-
99
-
100
-
101
-
102
-
103
-
104
-
105
-
106
-
107
-
108
-
109
-
110
-
111
-
112
-
113
-
114
-
115
-
116
-
117
-
118
-
119
-
120
-
121
-
122
-
123
-
124
-
125
-
126
-
127
-
128
-
129
-
130
-
131
-
132
-
133
-
134
-
135
-
136
-
137
-
138
-
139
-
140
-
141
-
142
-
143
-
144
-
145
-
146
-
147
-
148
-
149
-
150
-
151
-
152
-
153
-
154
-
155
-
156
-
157
-
158
-
159
-
160
-
161
-
162
-
163
-
164
-
165
-
166
-
167
-
168
-
169
-
170
-
171
-
172
-
173
-
174
-
175
-
176
-
177
-
178
-
179
-
180
-
181
-
182
-
183
-
184
-
185
-
186
-
187
-
188
-
189
-
190
-
191
-
192
-
193
-
194
-
195
-
196
-
197
-
198
-
199
-
200
-
201
-
202
-
203
-
204
-
205
-
206
-
207
-
208
-
209
-
210
-
211
-
212
-
213
-
214
-
215
-
216
-
217
-
218
-
219
-
220
-
221
-
222
-
223
-
224
-
225
-
226
-
227
-
228
-
229
-
230
-
231
-
232
-
233
-
234
-
235
-
236
-
237
-
238
-
239
-
240
-
241
-
242
-
243
-
244
-
245
-
246
-
247
-
248
-
249
-
250
-
251
-
252
-
253
-
 254
254 -
 255
255 -
 256
256 -
 257
257 -
 258
258 -
 259
259 -
 260
260 -
 261
261 -
 262
262 -
 263
263 -
 264
264 -
 265
265 -
 266
266 -
 267
267 -
 268
268 -
 269
269 -
 270
270 -
 271
271 -
 272
272 -
 273
273 -
 274
274 -
275
 |
 |

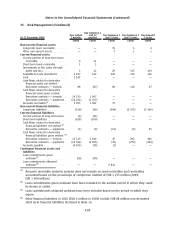
35. Risk Management (Continued)
At the end of the years 2010 and 2009, the following currencies represent a significant portion of the
currency mix in the outstanding financial instruments:
2010 USD JPY CNY INR
EURm EURm EURm EURm
FX derivatives used as cashflow hedges (net amount)
(1)
.......... (140) 521 — (23)
FX derivatives used as net investment hedges (net amount)
(2)
..... (642) — (2 834) (702)
FX exposure from balance sheet items (net amount)
(3)
........... (1645) (245) (710) (218)
FX derivatives not designated in a hedge relationship and carried
at fair value through profit and loss (net amount)
(3)
........... 26 645 2129 (95)
Cross currency / interest rate hedges ......................... 408 — — —
2009 USD JPY CNY INR
EURm EURm EURm EURm
FX derivatives used as cashflow hedges (net amount)
(1)
....... (1767) 663 — (78)
FX derivatives used as net investment hedges (net amount)
(2)
. . (969) (6) (983) (208)
FX exposure from balance sheet items (net amount)
(3)
........ (464) (421) (1 358) 80
FX derivatives not designated in a hedge relationship and
carried at fair value through profit and loss (net amount)
(3)
. . (328) 578 1 633 (164)
Cross currency / interest rate hedges ....................... 375 — — —
(1)
The FX derivatives are used to hedge the foreign exchange risk from forecasted highly probable
cashflows related to sales, purchases and business acquisition activities. In some of the
currencies, especially in US Dollar, Nokia has substantial foreign exchange risks in both estimated
cash inflows and outflows, which have been netted in the table. See Note 21 for more details on
hedge accounting. The underlying exposures for which these hedges are entered into are not
presented in the table, as they are not financial instruments as defined under IFRS 7.
(2)
The FX derivatives are used to hedge the Group’s net investment exposure. The underlying
exposures for which these hedges are entered into are not presented in the table, as they are not
financial instruments as defined under IFRS 7.
(3)
The balance sheet items and some probable forecasted cash flows, which are denominated in
foreign currencies, are hedged by a portion of FX derivatives not designated in a hedge
relationship and carried at fair value through profit and loss.
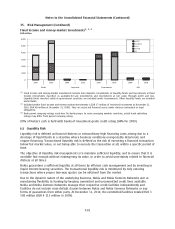
Interest rate risk
The Group is exposed to interest rate risk either through market value fluctuations of balance sheet
items (i.e. price risk) or through changes in interest income or expenses (i.e. refinancing or
reinvestment risk). Interest rate risk mainly arises through interest bearing liabilities and assets.
Estimated future changes in cash flows and balance sheet structure also expose the Group to interest
rate risk.
The objective of Interest rate risk management is to manage uncertainty caused by fluctuations in
interest rates and minimizing net longterm interest rate costs over time.
The interest rate exposure of the Group is monitored and managed centrally. Nokia uses the
ValueatRisk (VaR) methodology to assess and measure the interest rate risk of the net investments
(cash and investments less outstanding debt) and related derivatives.
F76
Notes to the Consolidated Financial Statements (Continued)