Nokia 2010 Annual Report Download - page 246
Download and view the complete annual report
Please find page 246 of the 2010 Nokia annual report below. You can navigate through the pages in the report by either clicking on the pages listed below, or by using the keyword search tool below to find specific information within the annual report.-
 1
1 -
2
-
3
-
4
-
5
-
6
-
7
-
8
-
9
-
10
-
11
-
12
-
13
-
14
-
15
-
16
-
17
-
18
-
19
-
20
-
21
-
22
-
23
-
24
-
25
-
26
-
27
-
28
-
29
-
30
-
31
-
32
-
33
-
34
-
35
-
36
-
37
-
38
-
39
-
40
-
41
-
42
-
43
-
44
-
45
-
46
-
47
-
48
-
49
-
50
-
51
-
52
-
53
-
54
-
55
-
56
-
57
-
58
-
59
-
60
-
61
-
62
-
63
-
64
-
65
-
66
-
67
-
68
-
69
-
70
-
71
-
72
-
73
-
74
-
75
-
76
-
77
-
78
-
79
-
80
-
81
-
82
-
83
-
84
-
85
-
86
-
87
-
88
-
89
-
90
-
91
-
92
-
93
-
94
-
95
-
96
-
97
-
98
-
99
-
100
-
101
-
102
-
103
-
104
-
105
-
106
-
107
-
108
-
109
-
110
-
111
-
112
-
113
-
114
-
115
-
116
-
117
-
118
-
119
-
120
-
121
-
122
-
123
-
124
-
125
-
126
-
127
-
128
-
129
-
130
-
131
-
132
-
133
-
134
-
135
-
136
-
137
-
138
-
139
-
140
-
141
-
142
-
143
-
144
-
145
-
146
-
147
-
148
-
149
-
150
-
151
-
152
-
153
-
154
-
155
-
156
-
157
-
158
-
159
-
160
-
161
-
162
-
163
-
164
-
165
-
166
-
167
-
168
-
169
-
170
-
171
-
172
-
173
-
174
-
175
-
176
-
177
-
178
-
179
-
180
-
181
-
182
-
183
-
184
-
185
-
186
-
187
-
188
-
189
-
190
-
191
-
192
-
193
-
194
-
195
-
196
-
197
-
198
-
199
-
200
-
201
-
202
-
203
-
204
-
205
-
206
-
207
-
208
-
209
-
210
-
211
-
212
-
213
-
214
-
215
-
216
-
217
-
218
-
219
-
220
-
221
-
222
-
223
-
224
-
225
-
226
-
227
-
228
-
229
-
230
-
231
-
232
-
233
-
234
-
235
-
 236
236 -
 237
237 -
 238
238 -
 239
239 -
 240
240 -
 241
241 -
 242
242 -
 243
243 -
 244
244 -
 245
245 -
 246
246 -
 247
247 -
 248
248 -
 249
249 -
 250
250 -
 251
251 -
 252
252 -
 253
253 -
 254
254 -
 255
255 -
 256
256 -
257
-
258
-
259
-
260
-
261
-
262
-
263
-
264
-
265
-
266
-
267
-
268
-
269
-
270
-
271
-
272
-
273
-
274
-
275
 |
 |

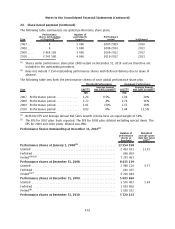
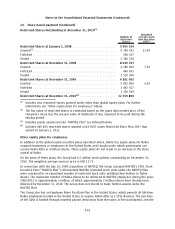
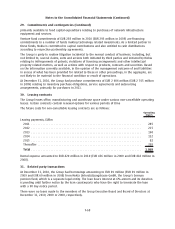
24. Sharebased payment (Continued)
The table below sets forth certain information relating to the stock options outstanding at
December 31, 2010.
Plan
(year
of launch)
Stock
options
outstanding
2010
Number of
participants
(approx.)
Option (sub)
category
Vesting
status
(as percentage of
total
number of
stock options
outstanding) First vest date Last vest date Expiry date
Exercise
price/
Share
Exercise period
EUR
2005
(1)
6 465 329 3 500 2005 2Q Expired July 1, 2006 July 1, 2009 December 31, 2010 12.79
2005 3Q Expired October 1, 2006 October 1, 2009 December 31, 2010 13.09
2005 4Q Expired January 1, 2007 January 1, 2010 December 31, 2010 14.48
2006 1Q 100.00 April 1, 2007 April 1, 2010 December 31, 2011 14.99
2006 2Q 100.00 July 1, 2007 July 1, 2010 December 31, 2011 18.02
2006 3Q 100.00 October 1, 2007 October 1, 2010 December 31, 2011 15.37
2006 4Q 93.75 January 1, 2008 January 1, 2011 December 31, 2011 15.38
2007 1Q 87.50 April 1, 2008 April 1, 2011 December 31, 2011 17.00
2007
(1)
15 278 270 11 000 2007 2Q 81.25 July 1, 2008 July 1, 2011 December 31, 2012 18.39
2007 3Q 75.00 October 1, 2008 October 1, 2011 December 31, 2012 21.86
2007 4Q 68.75 January 1, 2009 January 1, 2012 December 31, 2012 27.53
2008 1Q 62.50 April 1, 2009 April 1, 2012 December 31, 2013 24.15
2008 2Q 56.25 July 1, 2009 July 1, 2012 December 31, 2013 19.16
2008 3Q 50.00 October 1, 2009 October 1, 2012 December 31, 2013 17.80
2008 4Q 43.75 January 1, 2010 January 1, 2013 December 31, 2013 12.43
2009 1Q 37.50 April 1, 2010 April 1, 2013 December 31, 2014 9.82
2009 2Q 31.25 July 1, 2010 July 1, 2013 December 31, 2014 11.18
2009 3Q 25.00 October 1, 2010 October 1, 2013 December 31, 2014 9.28
2009 4Q — January 1, 2011 January 1, 2014 December 31, 2014 8.76
2010 1Q — April 1, 2011 April 1, 2014 December 31, 2015 10.11
2010 2Q — July 1, 2011 July 1, 2014 December 31, 2015 8.86
2010 3Q — October 1, 2011 October 1, 2014 December 31, 2015 7.29
2010 4Q — January 1, 2012 January 1, 2015 December 31, 2015 7.59
(1)
The Group’s current global stock option plans have a vesting schedule with a 25% vesting one
year after grant, and quarterly vesting thereafter, each of the quarterly lots representing 6.25% of
the total grant. The grants vest fully in four years.
F58
Notes to the Consolidated Financial Statements (Continued)