Nokia 2010 Annual Report Download - page 229
Download and view the complete annual report
Please find page 229 of the 2010 Nokia annual report below. You can navigate through the pages in the report by either clicking on the pages listed below, or by using the keyword search tool below to find specific information within the annual report.-
 1
1 -
2
-
3
-
4
-
5
-
6
-
7
-
8
-
9
-
10
-
11
-
12
-
13
-
14
-
15
-
16
-
17
-
18
-
19
-
20
-
21
-
22
-
23
-
24
-
25
-
26
-
27
-
28
-
29
-
30
-
31
-
32
-
33
-
34
-
35
-
36
-
37
-
38
-
39
-
40
-
41
-
42
-
43
-
44
-
45
-
46
-
47
-
48
-
49
-
50
-
51
-
52
-
53
-
54
-
55
-
56
-
57
-
58
-
59
-
60
-
61
-
62
-
63
-
64
-
65
-
66
-
67
-
68
-
69
-
70
-
71
-
72
-
73
-
74
-
75
-
76
-
77
-
78
-
79
-
80
-
81
-
82
-
83
-
84
-
85
-
86
-
87
-
88
-
89
-
90
-
91
-
92
-
93
-
94
-
95
-
96
-
97
-
98
-
99
-
100
-
101
-
102
-
103
-
104
-
105
-
106
-
107
-
108
-
109
-
110
-
111
-
112
-
113
-
114
-
115
-
116
-
117
-
118
-
119
-
120
-
121
-
122
-
123
-
124
-
125
-
126
-
127
-
128
-
129
-
130
-
131
-
132
-
133
-
134
-
135
-
136
-
137
-
138
-
139
-
140
-
141
-
142
-
143
-
144
-
145
-
146
-
147
-
148
-
149
-
150
-
151
-
152
-
153
-
154
-
155
-
156
-
157
-
158
-
159
-
160
-
161
-
162
-
163
-
164
-
165
-
166
-
167
-
168
-
169
-
170
-
171
-
172
-
173
-
174
-
175
-
176
-
177
-
178
-
179
-
180
-
181
-
182
-
183
-
184
-
185
-
186
-
187
-
188
-
189
-
190
-
191
-
192
-
193
-
194
-
195
-
196
-
197
-
198
-
199
-
200
-
201
-
202
-
203
-
204
-
205
-
206
-
207
-
208
-
209
-
210
-
211
-
212
-
213
-
214
-
215
-
216
-
217
-
218
-
 219
219 -
 220
220 -
 221
221 -
 222
222 -
 223
223 -
 224
224 -
 225
225 -
 226
226 -
 227
227 -
 228
228 -
 229
229 -
 230
230 -
 231
231 -
 232
232 -
 233
233 -
 234
234 -
 235
235 -
 236
236 -
 237
237 -
 238
238 -
 239
239 -
240
-
241
-
242
-
243
-
244
-
245
-
246
-
247
-
248
-
249
-
250
-
251
-
252
-
253
-
254
-
255
-
256
-
257
-
258
-
259
-
260
-
261
-
262
-
263
-
264
-
265
-
266
-
267
-
268
-
269
-
270
-
271
-
272
-
273
-
274
-
275
 |
 |

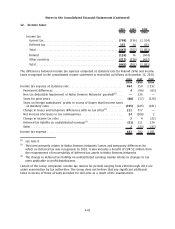
11. Financial income and expenses
2010 2009 2008
EURm
Dividend income on availableforsale financial investments ................. 231
Interest income on availableforsale financial investments .................. 110 101 357
Interest expense on financial liabilities carried at amortised cost ............. (254) (243) (185)
Net realised gains (or losses) on disposal of fixed income availableforsale
financial investments .............................................. 12 (4)
Net fair value gains (or losses) on investments at fair value through profit and
loss ............................................................ (3) 19 —
Interest income on investments at fair value through profit and loss .......... 28 11 —
Net fair value gains (or losses) on hedged items under fair value hedge
accounting ....................................................... (63) (4) —
Net fair value gains (or losses) on hedging instruments under fair value hedge
accounting ....................................................... 58 ——
Other financial income ............................................... 73 18 17
Other financial expenses.............................................. (129) (29) (31)
Net foreign exchange gains (or losses)
From foreign exchange derivatives designated at fair value through profit and
loss account .................................................... 58 (358) 432
From balance sheet items revaluation ................................. (165) 230 (595)
Net gains (net losses) on other derivatives designated at fair value through
profit and loss account ............................................. (1) (15) 6
Total ............................................................. (285) (265) (2)
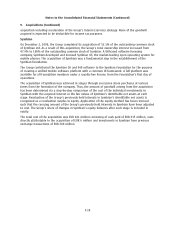
During 2010, the Group received distributions of EUR 69 million (2009 EUR 13 million) included in
other financial income from a private fund held as noncurrent availableforsale. Due to these
distributions resulting in a reduction in estimated future cash flows, the Group also recognized an
impairment loss of EUR 94 million (2009 EUR 9 million) for the fund included in other financial
expenses. Additional information can be found in Note 8 Impairments and Note 16 Fair Value of
Financial Instruments.
During 2009, interest income decreased significantly due to lower interest rates and interest expense
increased given higher long term funding with a higher cost.
During 2008, interest expense increased significantly due to increase in interestbearing liabilities
mainly related to NAVTEQ acquisition. Foreign exchange gains (or losses) increased due to higher cost
of hedging and increased volatility on the foreign exchange market.
F41
Notes to the Consolidated Financial Statements (Continued)