Nokia 2010 Annual Report Download - page 202
Download and view the complete annual report
Please find page 202 of the 2010 Nokia annual report below. You can navigate through the pages in the report by either clicking on the pages listed below, or by using the keyword search tool below to find specific information within the annual report.-
 1
1 -
2
-
3
-
4
-
5
-
6
-
7
-
8
-
9
-
10
-
11
-
12
-
13
-
14
-
15
-
16
-
17
-
18
-
19
-
20
-
21
-
22
-
23
-
24
-
25
-
26
-
27
-
28
-
29
-
30
-
31
-
32
-
33
-
34
-
35
-
36
-
37
-
38
-
39
-
40
-
41
-
42
-
43
-
44
-
45
-
46
-
47
-
48
-
49
-
50
-
51
-
52
-
53
-
54
-
55
-
56
-
57
-
58
-
59
-
60
-
61
-
62
-
63
-
64
-
65
-
66
-
67
-
68
-
69
-
70
-
71
-
72
-
73
-
74
-
75
-
76
-
77
-
78
-
79
-
80
-
81
-
82
-
83
-
84
-
85
-
86
-
87
-
88
-
89
-
90
-
91
-
92
-
93
-
94
-
95
-
96
-
97
-
98
-
99
-
100
-
101
-
102
-
103
-
104
-
105
-
106
-
107
-
108
-
109
-
110
-
111
-
112
-
113
-
114
-
115
-
116
-
117
-
118
-
119
-
120
-
121
-
122
-
123
-
124
-
125
-
126
-
127
-
128
-
129
-
130
-
131
-
132
-
133
-
134
-
135
-
136
-
137
-
138
-
139
-
140
-
141
-
142
-
143
-
144
-
145
-
146
-
147
-
148
-
149
-
150
-
151
-
152
-
153
-
154
-
155
-
156
-
157
-
158
-
159
-
160
-
161
-
162
-
163
-
164
-
165
-
166
-
167
-
168
-
169
-
170
-
171
-
172
-
173
-
174
-
175
-
176
-
177
-
178
-
179
-
180
-
181
-
182
-
183
-
184
-
185
-
186
-
187
-
188
-
189
-
190
-
191
-
 192
192 -
 193
193 -
 194
194 -
 195
195 -
 196
196 -
 197
197 -
 198
198 -
 199
199 -
 200
200 -
 201
201 -
 202
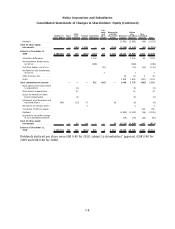
202 -
 203
203 -
 204
204 -
 205
205 -
 206
206 -
 207
207 -
 208
208 -
 209
209 -
 210
210 -
 211
211 -
 212
212 -
213
-
214
-
215
-
216
-
217
-
218
-
219
-
220
-
221
-
222
-
223
-
224
-
225
-
226
-
227
-
228
-
229
-
230
-
231
-
232
-
233
-
234
-
235
-
236
-
237
-
238
-
239
-
240
-
241
-
242
-
243
-
244
-
245
-
246
-
247
-
248
-
249
-
250
-
251
-
252
-
253
-
254
-
255
-
256
-
257
-
258
-
259
-
260
-
261
-
262
-
263
-
264
-
265
-
266
-
267
-
268
-
269
-
270
-
271
-
272
-
273
-
274
-
275
 |
 |
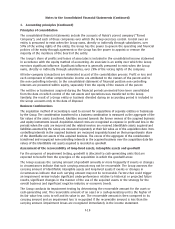
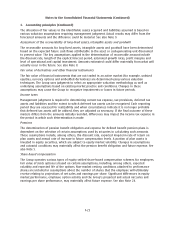
1. Accounting principles (Continued)
depreciated over the remaining useful life of the related asset. Leasehold improvements are
depreciated over the shorter of the lease term or useful life.
Gains and losses on the disposal of fixed assets are included in operating profit/loss.
Leases
The Group has entered into various operating leases, the payments under which are treated as rentals
and recognized in the income statement on a straightline basis over the lease terms unless another
systematic approach is more representative of the pattern of the user’s benefit.
Inventories
Inventories are stated at the lower of cost or net realizable value. Cost is determined using standard
cost, which approximates actual cost on a FIFO (Firstin Firstout) basis. Net realizable value is the
amount that can be realized from the sale of the inventory in the normal course of business after
allowing for the costs of realization.
In addition to the cost of materials and direct labor, an appropriate proportion of production
overhead is included in the inventory values.
An allowance is recorded for excess inventory and obsolescence based on the lower of cost or net
realizable value.
Financial assets
The Group has classified its financial assets as one of the following categories: availableforsale
investments, loans and receivables, financial assets at fair value through profit or loss and bank and
cash.
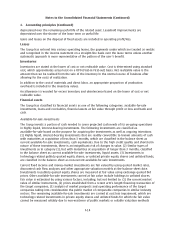
Availableforsale investments
The Group invests a portion of cash needed to cover projected cash needs of its ongoing operations
in highly liquid, interestbearing investments. The following investments are classified as
availableforsale based on the purpose for acquiring the investments as well as ongoing intentions:
(1) Highly liquid, interestbearing investments that are readily convertible to known amounts of cash
with maturities at acquisition of less than 3 months, which are classified in the balance sheet as
current availableforsale investments, cash equivalents. Due to the high credit quality and shortterm
nature of these investments, there is an insignificant risk of changes in value. (2) Similar types of
investments as in category (1), but with maturities at acquisition of longer than 3 months, classified
in the balance sheet as current availableforsale investments, liquid assets. (3) Investments in
technology related publicly quoted equity shares, or unlisted private equity shares and unlisted funds,
are classified in the balance sheet as noncurrent availableforsale investments.
Current fixed income and moneymarket investments are fair valued by using quoted market rates,
discounted cash flow analyses and other appropriate valuation models at the balance sheet date.
Investments in publicly quoted equity shares are measured at fair value using exchange quoted bid
prices. Other availableforsale investments carried at fair value include holdings in unlisted shares.
Fair value is estimated by using various factors, including, but not limited to: (1) the current market
value of similar instruments, (2) prices established from a recent arm’s length financing transaction of
the target companies, (3) analysis of market prospects and operating performance of the target
companies taking into consideration the public market of comparable companies in similar industry
sectors. The remaining availableforsale investments are carried at cost less impairment, which are
technology related investments in private equity shares and unlisted funds for which the fair value
cannot be measured reliably due to nonexistence of public markets or reliable valuation methods
F14
Notes to the Consolidated Financial Statements (Continued)