Nokia 2010 Annual Report Download - page 217
Download and view the complete annual report
Please find page 217 of the 2010 Nokia annual report below. You can navigate through the pages in the report by either clicking on the pages listed below, or by using the keyword search tool below to find specific information within the annual report.-
 1
1 -
2
-
3
-
4
-
5
-
6
-
7
-
8
-
9
-
10
-
11
-
12
-
13
-
14
-
15
-
16
-
17
-
18
-
19
-
20
-
21
-
22
-
23
-
24
-
25
-
26
-
27
-
28
-
29
-
30
-
31
-
32
-
33
-
34
-
35
-
36
-
37
-
38
-
39
-
40
-
41
-
42
-
43
-
44
-
45
-
46
-
47
-
48
-
49
-
50
-
51
-
52
-
53
-
54
-
55
-
56
-
57
-
58
-
59
-
60
-
61
-
62
-
63
-
64
-
65
-
66
-
67
-
68
-
69
-
70
-
71
-
72
-
73
-
74
-
75
-
76
-
77
-
78
-
79
-
80
-
81
-
82
-
83
-
84
-
85
-
86
-
87
-
88
-
89
-
90
-
91
-
92
-
93
-
94
-
95
-
96
-
97
-
98
-
99
-
100
-
101
-
102
-
103
-
104
-
105
-
106
-
107
-
108
-
109
-
110
-
111
-
112
-
113
-
114
-
115
-
116
-
117
-
118
-
119
-
120
-
121
-
122
-
123
-
124
-
125
-
126
-
127
-
128
-
129
-
130
-
131
-
132
-
133
-
134
-
135
-
136
-
137
-
138
-
139
-
140
-
141
-
142
-
143
-
144
-
145
-
146
-
147
-
148
-
149
-
150
-
151
-
152
-
153
-
154
-
155
-
156
-
157
-
158
-
159
-
160
-
161
-
162
-
163
-
164
-
165
-
166
-
167
-
168
-
169
-
170
-
171
-
172
-
173
-
174
-
175
-
176
-
177
-
178
-
179
-
180
-
181
-
182
-
183
-
184
-
185
-
186
-
187
-
188
-
189
-
190
-
191
-
192
-
193
-
194
-
195
-
196
-
197
-
198
-
199
-
200
-
201
-
202
-
203
-
204
-
205
-
206
-
 207
207 -
 208
208 -
 209
209 -
 210
210 -
 211
211 -
 212
212 -
 213
213 -
 214
214 -
 215
215 -
 216
216 -
 217
217 -
 218
218 -
 219
219 -
 220
220 -
 221
221 -
 222
222 -
 223
223 -
 224
224 -
 225
225 -
 226
226 -
 227
227 -
228
-
229
-
230
-
231
-
232
-
233
-
234
-
235
-
236
-
237
-
238
-
239
-
240
-
241
-
242
-
243
-
244
-
245
-
246
-
247
-
248
-
249
-
250
-
251
-
252
-
253
-
254
-
255
-
256
-
257
-
258
-
259
-
260
-
261
-
262
-
263
-
264
-
265
-
266
-
267
-
268
-
269
-
270
-
271
-
272
-
273
-
274
-
275
 |
 |

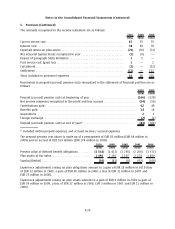
5. Pensions (Continued)
The following table sets forth the changes in the benefit obligation and fair value of plan assets
during the year and the funded status of the significant defined benefit pension plans showing the
amounts that are recognized in the Group’s consolidated statement of financial position at
December 31:
2010 2009
EURm EURm
Present value of defined benefit obligations at beginning of year ............... (1 411) (1 205)
Foreign exchange...................................................... (49) 5
Current service cost .................................................... (61) (55)
Interest cost .......................................................... (78) (69)
Plan participants’ contributions . . . ....................................... (8) (12)
Past service cost ...................................................... (1) —
Actuarial gain (loss) .................................................... 1(139)
Acquisitions .......................................................... (1) 2
Curtailment .......................................................... 1—
Settlements .......................................................... 17 2
Benefits paid ......................................................... 46 60
Present value of defined benefit obligations at end of year .................... (1 544) (1 411)
Plan assets at fair value at beginning of year ............................... 1 330 1 197
Foreign exchange...................................................... 44 (7)
Expected return on plan assets ........................................... 76 70
Actuarial gain (loss) on plan assets. ....................................... 956
Employer contribution .................................................. 62 49
Plan participants’ contributions . . . ....................................... 812
Benefits paid ......................................................... (32) (44)
Settlements .......................................................... (6) (2)
Acquisitions .......................................................... 3(1)
Plan assets at fair value at end of year..................................... 1 494 1 330
Surplus (Deficit) ....................................................... (50) (81)
Unrecognized net actuarial (gains) losses ................................... (26) (21)
Unrecognized past service cost ........................................... 11
Amount not recognized as an asset in the balance sheet because of limit in IAS 19
paragraph 58(b) ..................................................... (9) (5)
Prepaid (Accrued) pension cost in the statement of financial position ............ (84) (106)
Present value of obligations include EUR 932 million (EUR 822 million in 2009) of wholly funded
obligations, EUR 567 million of partly funded obligations (EUR 516 million in 2009) and
EUR 45 million (EUR 73 million in 2009) of unfunded obligations.
F29
Notes to the Consolidated Financial Statements (Continued)