Nokia 2010 Annual Report Download - page 109
Download and view the complete annual report
Please find page 109 of the 2010 Nokia annual report below. You can navigate through the pages in the report by either clicking on the pages listed below, or by using the keyword search tool below to find specific information within the annual report.-
 1
1 -
2
-
3
-
4
-
5
-
6
-
7
-
8
-
9
-
10
-
11
-
12
-
13
-
14
-
15
-
16
-
17
-
18
-
19
-
20
-
21
-
22
-
23
-
24
-
25
-
26
-
27
-
28
-
29
-
30
-
31
-
32
-
33
-
34
-
35
-
36
-
37
-
38
-
39
-
40
-
41
-
42
-
43
-
44
-
45
-
46
-
47
-
48
-
49
-
50
-
51
-
52
-
53
-
54
-
55
-
56
-
57
-
58
-
59
-
60
-
61
-
62
-
63
-
64
-
65
-
66
-
67
-
68
-
69
-
70
-
71
-
72
-
73
-
74
-
75
-
76
-
77
-
78
-
79
-
80
-
81
-
82
-
83
-
84
-
85
-
86
-
87
-
88
-
89
-
90
-
91
-
92
-
93
-
94
-
95
-
96
-
97
-
98
-
 99
99 -
 100
100 -
 101
101 -
 102
102 -
 103
103 -
 104
104 -
 105
105 -
 106
106 -
 107
107 -
 108
108 -
 109
109 -
 110
110 -
 111
111 -
 112
112 -
 113
113 -
 114
114 -
 115
115 -
 116
116 -
 117
117 -
 118
118 -
 119
119 -
120
-
121
-
122
-
123
-
124
-
125
-
126
-
127
-
128
-
129
-
130
-
131
-
132
-
133
-
134
-
135
-
136
-
137
-
138
-
139
-
140
-
141
-
142
-
143
-
144
-
145
-
146
-
147
-
148
-
149
-
150
-
151
-
152
-
153
-
154
-
155
-
156
-
157
-
158
-
159
-
160
-
161
-
162
-
163
-
164
-
165
-
166
-
167
-
168
-
169
-
170
-
171
-
172
-
173
-
174
-
175
-
176
-
177
-
178
-
179
-
180
-
181
-
182
-
183
-
184
-
185
-
186
-
187
-
188
-
189
-
190
-
191
-
192
-
193
-
194
-
195
-
196
-
197
-
198
-
199
-
200
-
201
-
202
-
203
-
204
-
205
-
206
-
207
-
208
-
209
-
210
-
211
-
212
-
213
-
214
-
215
-
216
-
217
-
218
-
219
-
220
-
221
-
222
-
223
-
224
-
225
-
226
-
227
-
228
-
229
-
230
-
231
-
232
-
233
-
234
-
235
-
236
-
237
-
238
-
239
-
240
-
241
-
242
-
243
-
244
-
245
-
246
-
247
-
248
-
249
-
250
-
251
-
252
-
253
-
254
-
255
-
256
-
257
-
258
-
259
-
260
-
261
-
262
-
263
-
264
-
265
-
266
-
267
-
268
-
269
-
270
-
271
-
272
-
273
-
274
-
275
 |
 |

issues continued to impact, but were less influential in the second half of the year, when the market
was more buoyant overall.
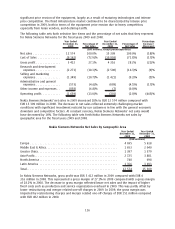
In 2010, in regional terms there was significant growth in North America as operators invested
heavily in upgrading both fixed and wireless networks. The Latin American market also recovered
from the severe downturn it experienced in 2009 and saw renewed operator investment. In Europe
there was slight growth. The Asia Pacific market was varied with growth in Japan and China,while
India contracted yearonyear as a result of the security clearance issue, despite 3G investment in the
second half. The Middle East and Africa region remained difficult as continued financial restraints and
a wave of consolidation in the market delayed investment.
In segment terms, the managed services market grew and there was continued strong investment in
mobile broadband infrastructure in 2010.
Globally in 2010, the network infrastructure equipment segment continued to be affected by
significant price erosion of the equipment, largely as a result of maturing technologies and intense
price competition, especially from Asian vendors.
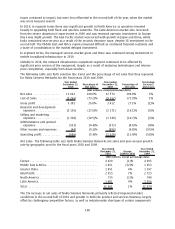
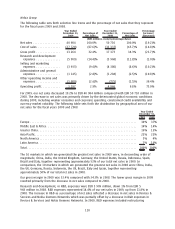
The following table sets forth selective line items and the percentage of net sales that they represent
for Nokia Siemens Networks for the fiscal years 2010 and 2009.
Year Ended
December 31,
2010
Percentage of
Net Sales
Year Ended
December 31,
2009
Percentage of
Net Sales
Percentage
Increase/
(Decrease)
(EUR millions, except percentage data)
Net sales ................. 12661 100.0% 12 574 100.0% 1%
Cost of Sales .............. (9266) (73.2)% (9 162) (72.9)% 1%
Gross profit ............... 3395 26.8% 3 412 27.1% (1)%
Research and development
expenses ............... (2156) (17.0)% (2 271) (18.1)% (5)%
Selling and marketing
expenses ............... (1328) (10.5)% (1 349) (10.7)% (2)%
Administrative and general
expenses ............... (553) (4.4)% (573) (4.6)% (4)%
Other income and expenses . . (44) (0.3)% (858) (6.8)% (95)%
Operating profit............ (686) (5.4)% (1 639) (13.0)% (58)%
Net Sales.
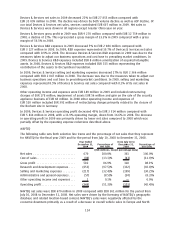
The following table sets forth Nokia Siemens Networks net sales and yearonyear growth
rate by geographic area for the fiscal years 2010 and 2009.
Year Ended
December 31,
2010
Change
2009 to 2010
Year Ended
December 31,
2009
(EUR millions, except percentage data)
Europe .......................................... 4628 (1)% 4695
Middle East & Africa ................................ 1451 (12)% 1653
Greater China ..................................... 1451 4% 1397
AsiaPacific. . ..................................... 2915 7% 2725
North America .................................... 735 (2)% 748
Latin America..................................... 1481 9% 1356
Total ............................................ 12661 1% 12574
The 1% increase in net sales of Nokia Siemens Networks primarily reflected improved market
conditions in the second half of 2010 and growth in both the product and services business, largely
offset by challenging competitive factors, as well as industrywide shortages of certain components
108