Nokia 2010 Annual Report Download - page 118
Download and view the complete annual report
Please find page 118 of the 2010 Nokia annual report below. You can navigate through the pages in the report by either clicking on the pages listed below, or by using the keyword search tool below to find specific information within the annual report.-
 1
1 -
2
-
3
-
4
-
5
-
6
-
7
-
8
-
9
-
10
-
11
-
12
-
13
-
14
-
15
-
16
-
17
-
18
-
19
-
20
-
21
-
22
-
23
-
24
-
25
-
26
-
27
-
28
-
29
-
30
-
31
-
32
-
33
-
34
-
35
-
36
-
37
-
38
-
39
-
40
-
41
-
42
-
43
-
44
-
45
-
46
-
47
-
48
-
49
-
50
-
51
-
52
-
53
-
54
-
55
-
56
-
57
-
58
-
59
-
60
-
61
-
62
-
63
-
64
-
65
-
66
-
67
-
68
-
69
-
70
-
71
-
72
-
73
-
74
-
75
-
76
-
77
-
78
-
79
-
80
-
81
-
82
-
83
-
84
-
85
-
86
-
87
-
88
-
89
-
90
-
91
-
92
-
93
-
94
-
95
-
96
-
97
-
98
-
99
-
100
-
101
-
102
-
103
-
104
-
105
-
106
-
107
-
 108
108 -
 109
109 -
 110
110 -
 111
111 -
 112
112 -
 113
113 -
 114
114 -
 115
115 -
 116
116 -
 117
117 -
 118
118 -
 119
119 -
 120
120 -
 121
121 -
 122
122 -
 123
123 -
 124
124 -
 125
125 -
 126
126 -
 127
127 -
 128
128 -
129
-
130
-
131
-
132
-
133
-
134
-
135
-
136
-
137
-
138
-
139
-
140
-
141
-
142
-
143
-
144
-
145
-
146
-
147
-
148
-
149
-
150
-
151
-
152
-
153
-
154
-
155
-
156
-
157
-
158
-
159
-
160
-
161
-
162
-
163
-
164
-
165
-
166
-
167
-
168
-
169
-
170
-
171
-
172
-
173
-
174
-
175
-
176
-
177
-
178
-
179
-
180
-
181
-
182
-
183
-
184
-
185
-
186
-
187
-
188
-
189
-
190
-
191
-
192
-
193
-
194
-
195
-
196
-
197
-
198
-
199
-
200
-
201
-
202
-
203
-
204
-
205
-
206
-
207
-
208
-
209
-
210
-
211
-
212
-
213
-
214
-
215
-
216
-
217
-
218
-
219
-
220
-
221
-
222
-
223
-
224
-
225
-
226
-
227
-
228
-
229
-
230
-
231
-
232
-
233
-
234
-
235
-
236
-
237
-
238
-
239
-
240
-
241
-
242
-
243
-
244
-
245
-
246
-
247
-
248
-
249
-
250
-
251
-
252
-
253
-
254
-
255
-
256
-
257
-
258
-
259
-
260
-
261
-
262
-
263
-
264
-
265
-
266
-
267
-
268
-
269
-
270
-
271
-
272
-
273
-
274
-
275
 |
 |
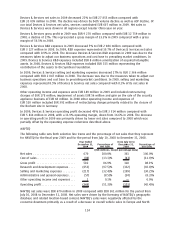
In Nokia Siemens Networks, R&D expenses decreased to EUR 2 271 million in 2009 compared with
EUR 2 500 million in 2008. In 2009, R&D expenses represented 18.1% of Nokia Siemens Networks net
sales compared with 16.3% in 2008. The decrease in R&D expenses resulted from the ongoing
harmonization of the product portfolio and a higher proportion of R&D activities being conducted in
lower cost countries. In 2009, R&D expenses included restructuring charges and other items of
EUR 30 million (EUR 46 million in 2008) and purchase price accounting related items of
EUR 180 million (EUR 180 million in 2008).
In 2009, Nokia Siemens Networks’ selling and marketing expenses decreased to EUR 1 349 million
compared with EUR 1 421 million in 2008. Nokia Siemens Networks’ selling and marketing expenses
represented 10.7% of its net sales in 2009 compared to 9.3% in 2008. The reduction in selling and
marketing expenses was related to ongoing restructuring and measures to reduce discretionary
expenditure. In 2009, selling and marketing expenses included restructuring charges of EUR 12 million
(EUR 14 million reversal of restructuring charges in 2008) and purchase price accounting related items
of EUR 286 million (EUR 286 million in 2008).
In 2009, other operating income and expenses included an impairment of goodwill of EUR 908 million
in the third quarter of 2009 due to a decline in forecasted profits and cash flows as a result of
challenging competitive factors and market conditions in the infrastructure and related service
business. In addition, other operating income and expenses included a restructuring charge and other
items of EUR 14 million, purchase price accounting related items of EUR 5 million and a gain of
EUR 22 million on the sale of real estate. In 2008, other operating income and expenses included a
restructuring charge and other items of EUR 49 million, purchase price accounting related items of
EUR 1 million and a gain of EUR 65 million from the transfer of Finnish pension liabilities to pension
insurance companies.
Nokia Siemens Networks 2009 operating loss was EUR 1 639 million compared to an operating loss of
EUR 301 million in 2008. In 2009, the operating loss included EUR 310 million of restructuring charges
and purchase price accounting related items of EUR 471 million. In 2008, the operating loss included
EUR 646 million of restructuring charges and purchase price accounting related items of
EUR 477 million. Nokia Siemens Networks’ operating margin for 2009 was negative 13.0% compared
with negative 2.0% in 2008. The increased operating loss resulted primarily from a nontax
deductible impairment of goodwill of EUR 908 million and lower net sales, the impact of which was
partially offset by lower cost of sales and lower operating expenses including the effects of reduced
restructuring charges in 2009.
Group Common Functions
Group Common Functions’ expenses totaled EUR 134 million in 2009 compared to EUR 396 million in
2008. In 2008, Corporate Common Functions’ operating profit included a EUR 217 million loss due to
transfer of Finnish pension liabilities to pension insurance companies.
Net Financial Income and Expenses
During 2009, Nokia’s net financial expense was EUR 265 million, compared with net financial expense
of EUR 2 million in 2008. This change was primarily caused by lower interest income due to a
decrease of assets and exceptionally low interest rates, as well as an increase in interest expenses
due to the issuance of longterm debt.
The net debt to equity ratio was negative 25% at December 31, 2009 compared with a net debt to
equity ratio of negative 14% at December 31, 2008. See Item 5B. “Liquidity and Capital Resources”
below.
Profit Before Taxes
Profit before tax decreased 81% to EUR 962 million in 2009 compared with EUR 4 970 million in
2008. Taxes amounted to EUR 702 million and EUR 1 081 million in 2009 and 2008, respectively. The
117