Nokia 2010 Annual Report Download - page 247
Download and view the complete annual report
Please find page 247 of the 2010 Nokia annual report below. You can navigate through the pages in the report by either clicking on the pages listed below, or by using the keyword search tool below to find specific information within the annual report.-
 1
1 -
2
-
3
-
4
-
5
-
6
-
7
-
8
-
9
-
10
-
11
-
12
-
13
-
14
-
15
-
16
-
17
-
18
-
19
-
20
-
21
-
22
-
23
-
24
-
25
-
26
-
27
-
28
-
29
-
30
-
31
-
32
-
33
-
34
-
35
-
36
-
37
-
38
-
39
-
40
-
41
-
42
-
43
-
44
-
45
-
46
-
47
-
48
-
49
-
50
-
51
-
52
-
53
-
54
-
55
-
56
-
57
-
58
-
59
-
60
-
61
-
62
-
63
-
64
-
65
-
66
-
67
-
68
-
69
-
70
-
71
-
72
-
73
-
74
-
75
-
76
-
77
-
78
-
79
-
80
-
81
-
82
-
83
-
84
-
85
-
86
-
87
-
88
-
89
-
90
-
91
-
92
-
93
-
94
-
95
-
96
-
97
-
98
-
99
-
100
-
101
-
102
-
103
-
104
-
105
-
106
-
107
-
108
-
109
-
110
-
111
-
112
-
113
-
114
-
115
-
116
-
117
-
118
-
119
-
120
-
121
-
122
-
123
-
124
-
125
-
126
-
127
-
128
-
129
-
130
-
131
-
132
-
133
-
134
-
135
-
136
-
137
-
138
-
139
-
140
-
141
-
142
-
143
-
144
-
145
-
146
-
147
-
148
-
149
-
150
-
151
-
152
-
153
-
154
-
155
-
156
-
157
-
158
-
159
-
160
-
161
-
162
-
163
-
164
-
165
-
166
-
167
-
168
-
169
-
170
-
171
-
172
-
173
-
174
-
175
-
176
-
177
-
178
-
179
-
180
-
181
-
182
-
183
-
184
-
185
-
186
-
187
-
188
-
189
-
190
-
191
-
192
-
193
-
194
-
195
-
196
-
197
-
198
-
199
-
200
-
201
-
202
-
203
-
204
-
205
-
206
-
207
-
208
-
209
-
210
-
211
-
212
-
213
-
214
-
215
-
216
-
217
-
218
-
219
-
220
-
221
-
222
-
223
-
224
-
225
-
226
-
227
-
228
-
229
-
230
-
231
-
232
-
233
-
234
-
235
-
236
-
 237
237 -
 238
238 -
 239
239 -
 240
240 -
 241
241 -
 242
242 -
 243
243 -
 244
244 -
 245
245 -
 246
246 -
 247
247 -
 248
248 -
 249
249 -
 250
250 -
 251
251 -
 252
252 -
 253
253 -
 254
254 -
 255
255 -
 256
256 -
 257
257 -
258
-
259
-
260
-
261
-
262
-
263
-
264
-
265
-
266
-
267
-
268
-
269
-
270
-
271
-
272
-
273
-
274
-
275
 |
 |

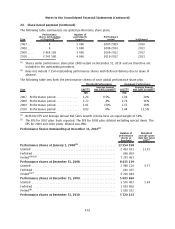
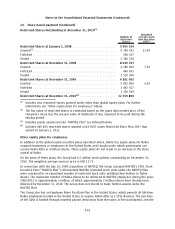
24. Sharebased payment (Continued)
Total stock options outstanding at December 31, 2010
(1)
Number of shares
Weighted average
exercise price
EUR
(2)
Weighted
average share
price EUR
(2)
Shares under option at January 1, 2008....... 35 567 227 15.28
Granted................................... 3767163 17.44
Exercised ................................. 3657985 14.21 22.15
Forfeited .................................. 783557 16.31
Expired ................................... 11078983 14.96
Shares under option at December 31, 2008.... 23 813 865 15.89
Granted................................... 4791232 11.15
Exercised ................................. 104172 6.18 9.52
Forfeited .................................. 893943 17.01
Expired ................................... 4567020 13.55
Shares under option at December 31, 2009.... 23 039 962 15.39
Granted................................... 6708582 8.73
Exercised ................................. 39772 2.20 9.44
Forfeited .................................. 1698435 12.07
Expired ................................... 6065041 13.97
Shares under option at December 31, 2010.... 21 945 296 14.04
Options exercisable at December 31, 2007
(shares) ................................. 21535000 14.66
Options exercisable at December 31, 2008
(shares) ................................. 12895057 14.77
Options exercisable at December 31, 2009
(shares) ................................. 13124925 16.09
Options exercisable at December 31, 2010
(shares) ................................. 11 376 937 17.07
(1)
Includes also stock options granted under other than global equity plans. For further information
see “Other equity plans for employees” below.
(2)
The weighted average exercise price and the weighted average share price do not incorporate the
effect of transferable stock option exercises during 2007 by option holders not employed by the
Group.
The weighted average grant date fair value of stock options granted was EUR 2.29 in 2010, EUR 2.34
in 2009 and EUR 3.92 in 2008.
F59
Notes to the Consolidated Financial Statements (Continued)