Nokia 2010 Annual Report Download - page 248
Download and view the complete annual report
Please find page 248 of the 2010 Nokia annual report below. You can navigate through the pages in the report by either clicking on the pages listed below, or by using the keyword search tool below to find specific information within the annual report.-
 1
1 -
2
-
3
-
4
-
5
-
6
-
7
-
8
-
9
-
10
-
11
-
12
-
13
-
14
-
15
-
16
-
17
-
18
-
19
-
20
-
21
-
22
-
23
-
24
-
25
-
26
-
27
-
28
-
29
-
30
-
31
-
32
-
33
-
34
-
35
-
36
-
37
-
38
-
39
-
40
-
41
-
42
-
43
-
44
-
45
-
46
-
47
-
48
-
49
-
50
-
51
-
52
-
53
-
54
-
55
-
56
-
57
-
58
-
59
-
60
-
61
-
62
-
63
-
64
-
65
-
66
-
67
-
68
-
69
-
70
-
71
-
72
-
73
-
74
-
75
-
76
-
77
-
78
-
79
-
80
-
81
-
82
-
83
-
84
-
85
-
86
-
87
-
88
-
89
-
90
-
91
-
92
-
93
-
94
-
95
-
96
-
97
-
98
-
99
-
100
-
101
-
102
-
103
-
104
-
105
-
106
-
107
-
108
-
109
-
110
-
111
-
112
-
113
-
114
-
115
-
116
-
117
-
118
-
119
-
120
-
121
-
122
-
123
-
124
-
125
-
126
-
127
-
128
-
129
-
130
-
131
-
132
-
133
-
134
-
135
-
136
-
137
-
138
-
139
-
140
-
141
-
142
-
143
-
144
-
145
-
146
-
147
-
148
-
149
-
150
-
151
-
152
-
153
-
154
-
155
-
156
-
157
-
158
-
159
-
160
-
161
-
162
-
163
-
164
-
165
-
166
-
167
-
168
-
169
-
170
-
171
-
172
-
173
-
174
-
175
-
176
-
177
-
178
-
179
-
180
-
181
-
182
-
183
-
184
-
185
-
186
-
187
-
188
-
189
-
190
-
191
-
192
-
193
-
194
-
195
-
196
-
197
-
198
-
199
-
200
-
201
-
202
-
203
-
204
-
205
-
206
-
207
-
208
-
209
-
210
-
211
-
212
-
213
-
214
-
215
-
216
-
217
-
218
-
219
-
220
-
221
-
222
-
223
-
224
-
225
-
226
-
227
-
228
-
229
-
230
-
231
-
232
-
233
-
234
-
235
-
236
-
237
-
 238
238 -
 239
239 -
 240
240 -
 241
241 -
 242
242 -
 243
243 -
 244
244 -
 245
245 -
 246
246 -
 247
247 -
 248
248 -
 249
249 -
 250
250 -
 251
251 -
 252
252 -
 253
253 -
 254
254 -
 255
255 -
 256
256 -
 257
257 -
 258
258 -
259
-
260
-
261
-
262
-
263
-
264
-
265
-
266
-
267
-
268
-
269
-
270
-
271
-
272
-
273
-
274
-
275
 |
 |

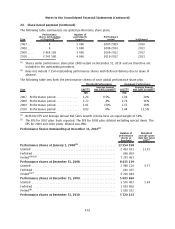
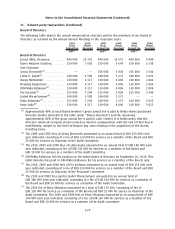
24. Sharebased payment (Continued)
The options outstanding by range of exercise price at December 31, 2010 are as follows:
Exercise prices EUR Number of shares
Weighted average
remaining
contractual life
in years
Weighted
average
exercise
price EUR
Options outstanding
0.949.82 .................................... 6201937 5.00 8.66
10.1114.99 .................................. 4973503 3.78 11.46
15.3719.16 .................................. 10681907 1.61 18.28
19.4327.53 .................................. 87949 1.70 23.96
21 945 296
Nokia calculates the fair value of stock options using the BlackScholes model. The fair value of the
stock options is estimated at the grant date using the following assumptions:
2010 2009 2008
Weighted average expected dividend yield ...... 4.73% 3.63% 3.20%
Weighted average expected volatility .......... 52.09% 43.46% 39.92%
Riskfree interest rate ....................... 1.52% 2.49% 1.97% 2.94% 3.15% 4.58%
Weighted average riskfree interest rate ........ 1.78% 2.23% 3.65%
Expected life (years) ........................ 3.59 3.60 3.55
Weighted average share price, EUR ............ 8.27 10.82 16.97
Expected term of stock options is estimated by observing general option holder behavior and actual
historical terms of Nokia stock option plans.
Expected volatility has been set by reference to the implied volatility of options available on Nokia
shares in the open market and in light of historical patterns of volatility.
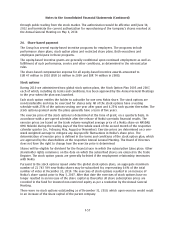
Performance shares
During 2010, Nokia administered four global performance share plans, the Performance Share Plans of
2007, 2008, 2009 and 2010, each of which, including its terms and conditions, has been approved by
the Board of Directors.
The performance shares represent a commitment by Nokia Corporation to deliver Nokia shares to
employees at a future point in time, subject to Nokia’s fulfillment of predefined performance criteria.
No performance shares will vest unless the Group’s performance reaches at least one of the threshold
levels measured by two independent, predefined performance criteria: the Group’s average annual
net sales growth for the performance period of the plan and earnings per share (“EPS”) at the end of
the performance period.
The 2007, 2008, 2009 and 2010 plans have a threeyear performance period with no interim payout.
The shares vest after the respective performance period. The shares will be delivered to the
participants as soon as practicable after they vest. Until the Nokia shares are delivered, the
participants will not have any shareholder rights, such as voting or dividend rights associated with
the performance shares. The performance share grants are generally forfeited if the employment
relationship terminates with Nokia prior to vesting.
F60
Notes to the Consolidated Financial Statements (Continued)