Nokia 2010 Annual Report Download - page 249
Download and view the complete annual report
Please find page 249 of the 2010 Nokia annual report below. You can navigate through the pages in the report by either clicking on the pages listed below, or by using the keyword search tool below to find specific information within the annual report.-
 1
1 -
2
-
3
-
4
-
5
-
6
-
7
-
8
-
9
-
10
-
11
-
12
-
13
-
14
-
15
-
16
-
17
-
18
-
19
-
20
-
21
-
22
-
23
-
24
-
25
-
26
-
27
-
28
-
29
-
30
-
31
-
32
-
33
-
34
-
35
-
36
-
37
-
38
-
39
-
40
-
41
-
42
-
43
-
44
-
45
-
46
-
47
-
48
-
49
-
50
-
51
-
52
-
53
-
54
-
55
-
56
-
57
-
58
-
59
-
60
-
61
-
62
-
63
-
64
-
65
-
66
-
67
-
68
-
69
-
70
-
71
-
72
-
73
-
74
-
75
-
76
-
77
-
78
-
79
-
80
-
81
-
82
-
83
-
84
-
85
-
86
-
87
-
88
-
89
-
90
-
91
-
92
-
93
-
94
-
95
-
96
-
97
-
98
-
99
-
100
-
101
-
102
-
103
-
104
-
105
-
106
-
107
-
108
-
109
-
110
-
111
-
112
-
113
-
114
-
115
-
116
-
117
-
118
-
119
-
120
-
121
-
122
-
123
-
124
-
125
-
126
-
127
-
128
-
129
-
130
-
131
-
132
-
133
-
134
-
135
-
136
-
137
-
138
-
139
-
140
-
141
-
142
-
143
-
144
-
145
-
146
-
147
-
148
-
149
-
150
-
151
-
152
-
153
-
154
-
155
-
156
-
157
-
158
-
159
-
160
-
161
-
162
-
163
-
164
-
165
-
166
-
167
-
168
-
169
-
170
-
171
-
172
-
173
-
174
-
175
-
176
-
177
-
178
-
179
-
180
-
181
-
182
-
183
-
184
-
185
-
186
-
187
-
188
-
189
-
190
-
191
-
192
-
193
-
194
-
195
-
196
-
197
-
198
-
199
-
200
-
201
-
202
-
203
-
204
-
205
-
206
-
207
-
208
-
209
-
210
-
211
-
212
-
213
-
214
-
215
-
216
-
217
-
218
-
219
-
220
-
221
-
222
-
223
-
224
-
225
-
226
-
227
-
228
-
229
-
230
-
231
-
232
-
233
-
234
-
235
-
236
-
237
-
238
-
 239
239 -
 240
240 -
 241
241 -
 242
242 -
 243
243 -
 244
244 -
 245
245 -
 246
246 -
 247
247 -
 248
248 -
 249
249 -
 250
250 -
 251
251 -
 252
252 -
 253
253 -
 254
254 -
 255
255 -
 256
256 -
 257
257 -
 258
258 -
 259
259 -
260
-
261
-
262
-
263
-
264
-
265
-
266
-
267
-
268
-
269
-
270
-
271
-
272
-
273
-
274
-
275
 |
 |

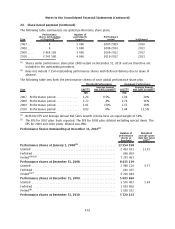
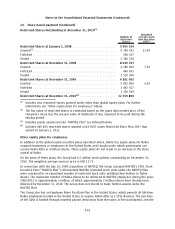
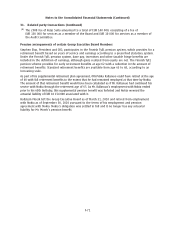
24. Sharebased payment (Continued)
The following table summarizes our global performance share plans.
Plan
Performance
shares outstanding
at threshold
(1)(2)
Number of
participants
(approx.)
Performance
period Settlement
2007 .... 0 5000 20072009 2010
2008 .... 0 5000 20082010 2011
2009 .... 2469189 5000 20092011 2012
2010 .... 3243580 4000 20102012 2013
(1)
Shares under performance share plan 2008 vested on December 31, 2010 and are therefore not
included in the outstanding numbers.
(2)
Does not include 7 354 outstanding performance shares with deferred delivery due to leave of
absence.
The following table sets forth the performance criteria of each global performance share plan.
Plan EPS
(1)(2)
Average Annual
Net Sales Growth
(1)
EPS
(1)(2)
Average Annual
Net Sales Growth
(1)
Threshold Performance Maximum Performance
EUR EUR
2007 Performance period ............. 1.26 9.5% 1.86 20%
2008 Performance period ............. 1.72 4% 2.76 16%
2009 Performance period ............. 1.01 (5)% 1.53 10%
2010 Performance period ............. 0.82 0% 1.44 13.5%
(1)
Both the EPS and Average Annual Net Sales Growth criteria have an equal weight of 50%.
(2)
The EPS for 2007 plan: basic reported. The EPS for 2008 plan: diluted excluding special items. The
EPS for 2009 and 2010 plans: diluted nonIFRS.
Performance Shares Outstanding at December 31, 2010
(1)
Number of
performance
shares at
threshold
Weighted
average grant
date fair value
EUR
(2)
Performance shares at January 1, 2008
(5)
....................... 13 554 558
Granted .................................................... 2463033 13.35
Forfeited ................................................... 690909
Vested
(3)(4)(6)
................................................ 7291463
Performance shares at December 31, 2008 ...................... 8 035 219
Granted .................................................... 2960110 9.57
Forfeited ................................................... 691325
Vested
(5)(7)
.................................................. 5210044
Performance shares at December 31, 2009 ...................... 5 093 960
Granted .................................................... 3576403 5.94
Forfeited ................................................... 1039908
Vested
(8)
.................................................... 1910332
Performance shares at December 31, 2010 ...................... 5 720 123
F61
Notes to the Consolidated Financial Statements (Continued)