Nokia 2010 Annual Report Download - page 266
Download and view the complete annual report
Please find page 266 of the 2010 Nokia annual report below. You can navigate through the pages in the report by either clicking on the pages listed below, or by using the keyword search tool below to find specific information within the annual report.-
 1
1 -
2
-
3
-
4
-
5
-
6
-
7
-
8
-
9
-
10
-
11
-
12
-
13
-
14
-
15
-
16
-
17
-
18
-
19
-
20
-
21
-
22
-
23
-
24
-
25
-
26
-
27
-
28
-
29
-
30
-
31
-
32
-
33
-
34
-
35
-
36
-
37
-
38
-
39
-
40
-
41
-
42
-
43
-
44
-
45
-
46
-
47
-
48
-
49
-
50
-
51
-
52
-
53
-
54
-
55
-
56
-
57
-
58
-
59
-
60
-
61
-
62
-
63
-
64
-
65
-
66
-
67
-
68
-
69
-
70
-
71
-
72
-
73
-
74
-
75
-
76
-
77
-
78
-
79
-
80
-
81
-
82
-
83
-
84
-
85
-
86
-
87
-
88
-
89
-
90
-
91
-
92
-
93
-
94
-
95
-
96
-
97
-
98
-
99
-
100
-
101
-
102
-
103
-
104
-
105
-
106
-
107
-
108
-
109
-
110
-
111
-
112
-
113
-
114
-
115
-
116
-
117
-
118
-
119
-
120
-
121
-
122
-
123
-
124
-
125
-
126
-
127
-
128
-
129
-
130
-
131
-
132
-
133
-
134
-
135
-
136
-
137
-
138
-
139
-
140
-
141
-
142
-
143
-
144
-
145
-
146
-
147
-
148
-
149
-
150
-
151
-
152
-
153
-
154
-
155
-
156
-
157
-
158
-
159
-
160
-
161
-
162
-
163
-
164
-
165
-
166
-
167
-
168
-
169
-
170
-
171
-
172
-
173
-
174
-
175
-
176
-
177
-
178
-
179
-
180
-
181
-
182
-
183
-
184
-
185
-
186
-
187
-
188
-
189
-
190
-
191
-
192
-
193
-
194
-
195
-
196
-
197
-
198
-
199
-
200
-
201
-
202
-
203
-
204
-
205
-
206
-
207
-
208
-
209
-
210
-
211
-
212
-
213
-
214
-
215
-
216
-
217
-
218
-
219
-
220
-
221
-
222
-
223
-
224
-
225
-
226
-
227
-
228
-
229
-
230
-
231
-
232
-
233
-
234
-
235
-
236
-
237
-
238
-
239
-
240
-
241
-
242
-
243
-
244
-
245
-
246
-
247
-
248
-
249
-
250
-
251
-
252
-
253
-
254
-
255
-
 256
256 -
 257
257 -
 258
258 -
 259
259 -
 260
260 -
 261
261 -
 262
262 -
 263
263 -
 264
264 -
 265
265 -
 266
266 -
 267
267 -
 268
268 -
 269
269 -
 270
270 -
 271
271 -
 272
272 -
 273
273 -
 274
274 -
 275
275
 |
 |

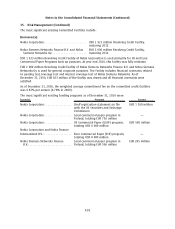
35. Risk Management (Continued)
movements in market risk factors follow estimated historical movements; c) the assessed exposures
do not change during the holding period. Thus it is possible that, for any given month, the potential
losses at 95% confidence level are different and could be substantially higher than the estimated VaR.
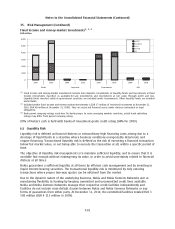
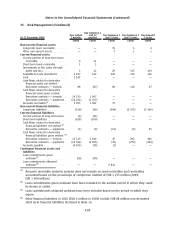
FX risk
The VaR figures for the Group’s financial instruments, which are sensitive to foreign exchange risks,
are presented in Table 1 below. As defined under IFRS 7, the financial instruments included in the VaR
calculation are:
• FX exposures from outstanding balance sheet items and other FX derivatives carried at fair value
through profit and loss, which are not in a hedge relationship and are mostly used for hedging
balance sheet FX exposure.
• FX derivatives designated as forecasted cash flow hedges and net investment hedges. Most of the
VaR is caused by these derivatives as forecasted cash flow and net investment exposures are not
financial instruments as defined under IFRS 7 and thus not included in the VaR calculation.
Table 1 Foreign exchange positions ValueatRisk
2010 2009
VaR from financial
instruments
EURm EURm
At December 31 .................................................... 245 190
Average for the year ................................................ 223 291
Range for the year .................................................. 174299 160520
Interest rate risk
The VaR for the Group interest rate exposure in the investment and debt portfolios is presented in
Table 2 below. Sensitivities to credit spreads are not reflected in the below numbers.
Table 2 Treasury investment and debt portfolios ValueatRisk
2010 2009
EURm EURm
At December 31 ......................................................... 45 41
Average for the year ..................................................... 43 33
Range for the year....................................................... 3363 452
Equity price risk
The VaR for the Group equity investment in publicly traded companies is insignificant.
(b) Credit Risk
Credit risk refers to the risk that a counterparty will default on its contractual obligations resulting in
financial loss to the Group. Credit risk arises from bank and cash, fixed income and moneymarket
investments, derivative financial instruments, loans receivable as well as credit exposures to
customers, including outstanding receivables, financial guarantees and committed transactions. Credit
risk is managed separately for business related and financial credit exposures.
F78
Notes to the Consolidated Financial Statements (Continued)