Nokia 2010 Annual Report Download - page 116
Download and view the complete annual report
Please find page 116 of the 2010 Nokia annual report below. You can navigate through the pages in the report by either clicking on the pages listed below, or by using the keyword search tool below to find specific information within the annual report.-
 1
1 -
2
-
3
-
4
-
5
-
6
-
7
-
8
-
9
-
10
-
11
-
12
-
13
-
14
-
15
-
16
-
17
-
18
-
19
-
20
-
21
-
22
-
23
-
24
-
25
-
26
-
27
-
28
-
29
-
30
-
31
-
32
-
33
-
34
-
35
-
36
-
37
-
38
-
39
-
40
-
41
-
42
-
43
-
44
-
45
-
46
-
47
-
48
-
49
-
50
-
51
-
52
-
53
-
54
-
55
-
56
-
57
-
58
-
59
-
60
-
61
-
62
-
63
-
64
-
65
-
66
-
67
-
68
-
69
-
70
-
71
-
72
-
73
-
74
-
75
-
76
-
77
-
78
-
79
-
80
-
81
-
82
-
83
-
84
-
85
-
86
-
87
-
88
-
89
-
90
-
91
-
92
-
93
-
94
-
95
-
96
-
97
-
98
-
99
-
100
-
101
-
102
-
103
-
104
-
105
-
 106
106 -
 107
107 -
 108
108 -
 109
109 -
 110
110 -
 111
111 -
 112
112 -
 113
113 -
 114
114 -
 115
115 -
 116
116 -
 117
117 -
 118
118 -
 119
119 -
 120
120 -
 121
121 -
 122
122 -
 123
123 -
 124
124 -
 125
125 -
 126
126 -
127
-
128
-
129
-
130
-
131
-
132
-
133
-
134
-
135
-
136
-
137
-
138
-
139
-
140
-
141
-
142
-
143
-
144
-
145
-
146
-
147
-
148
-
149
-
150
-
151
-
152
-
153
-
154
-
155
-
156
-
157
-
158
-
159
-
160
-
161
-
162
-
163
-
164
-
165
-
166
-
167
-
168
-
169
-
170
-
171
-
172
-
173
-
174
-
175
-
176
-
177
-
178
-
179
-
180
-
181
-
182
-
183
-
184
-
185
-
186
-
187
-
188
-
189
-
190
-
191
-
192
-
193
-
194
-
195
-
196
-
197
-
198
-
199
-
200
-
201
-
202
-
203
-
204
-
205
-
206
-
207
-
208
-
209
-
210
-
211
-
212
-
213
-
214
-
215
-
216
-
217
-
218
-
219
-
220
-
221
-
222
-
223
-
224
-
225
-
226
-
227
-
228
-
229
-
230
-
231
-
232
-
233
-
234
-
235
-
236
-
237
-
238
-
239
-
240
-
241
-
242
-
243
-
244
-
245
-
246
-
247
-
248
-
249
-
250
-
251
-
252
-
253
-
254
-
255
-
256
-
257
-
258
-
259
-
260
-
261
-
262
-
263
-
264
-
265
-
266
-
267
-
268
-
269
-
270
-
271
-
272
-
273
-
274
-
275
 |
 |

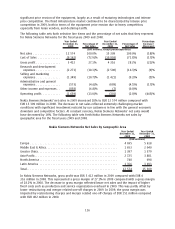
America and consumer trend towards the purchase of lowerend car classes. The following table sets
forth NAVTEQ net sales by geographic area for the fiscal year 2009 and for the period from July 10,
2008 to December 31, 2008.
For the Year Ended
December 31,
2009
From July 10 to
December 31,
2008
(EUR millions) (EUR millions)
Europe ................................................. 312 158
Middle East & Africa ....................................... 29 29
Greater China ............................................ 5 2
AsiaPacific .............................................. 18 10
North America ........................................... 293 155
Latin America ............................................ 13 7
Total . .................................................. 670 361
For the fiscal year 2009, NAVTEQ gross profit was EUR 582 million compared with EUR 318 million for
the period from July 10, 2008 to December 31, 2008. Gross profit reflects net sales, partially offset by
costs related to the delivery of NAVTEQ’s database information to its customers.
NAVTEQ R&D expenses in 2009 were EUR 653 million compared with EUR 332 million for the period
from July 10, 2008 to December 31, 2008. NAVTEQ R&D expenses included amortization of intangible
assets recorded as part of Nokia’s acquisition of NAVTEQ totaling EUR 346 million and EUR 171 million
in 2009 and 2008, respectively. R&D expenses were also driven by increased investment in NAVTEQ’s
map database related to geographic expansion and quality improvements. R&D expenses represented
97.5% of NAVTEQ net sales in 2009 compared to 92.0% of NAVTEQ net sales in 2008.
NAVTEQ selling and marketing expenses in 2009 were EUR 217 million compared with EUR 109 million
for the period from July 10, 2008 to December 31, 2008. NAVTEQ selling and marketing expenses
primarily consisted of amortization of intangible assets recorded as part of Nokia’s acquisition of
NAVTEQ totaling EUR 115 million and EUR 57 million in 2009 and 2008, respectively. Selling and
marketing expenses were also driven by investments to grow NAVTEQ’s worldwide sales force and
expand the breadth of its product offerings. Selling and marketing expenses represented 32.4% of
NAVTEQ net sales in 2009 compared to 30.2% of NAVTEQ net sales in 2008.
NAVTEQ operating loss in 2009 was EUR 344 million, with an operating margin of negative 51.3%
compared with operating loss of EUR 153 million and with an operating margin of negative 42.4% for
the period from July 10, 2008 to December 31, 2008. The operating loss in both periods was primarily
the result of the amortization of intangible assets recorded as part of Nokia’s acquisition of NAVTEQ,
which was partially offset by profits from NAVTEQ’s ongoing business.
Nokia Siemens Networks
According to our estimates, the mobile infrastructure market declined by about 5% in euro terms in
2009 compared to 2008 with the trend varying, depending on region. The primary cause of the
decline was the deterioration in global economic conditions, which caused many operators to delay
investments in network infrastructure. In many markets, this was characterized by caution on the part
of operators concerned about enduser behavior and subsequent declining revenues, but in certain
markets, including parts of Asia Pacific, Middle East and Africa and Eastern Europe, restricted access to
financing resulted in capital expenditures being cancelled. The emerging professional services
segment also continued to grow as operators sought efficiencies for their network through
outsourcing network management to infrastructure vendors. The mobile infrastructure market was
characterized by a decline in investment in 2G networks which was not offset by continued
investment in 3G. One exception was China, where investment in 3G rollouts resulted in growth in
that market. Globally, the network infrastructure equipment segment continued to be affected by
115