Nokia 2010 Annual Report Download - page 147
Download and view the complete annual report
Please find page 147 of the 2010 Nokia annual report below. You can navigate through the pages in the report by either clicking on the pages listed below, or by using the keyword search tool below to find specific information within the annual report.-
 1
1 -
2
-
3
-
4
-
5
-
6
-
7
-
8
-
9
-
10
-
11
-
12
-
13
-
14
-
15
-
16
-
17
-
18
-
19
-
20
-
21
-
22
-
23
-
24
-
25
-
26
-
27
-
28
-
29
-
30
-
31
-
32
-
33
-
34
-
35
-
36
-
37
-
38
-
39
-
40
-
41
-
42
-
43
-
44
-
45
-
46
-
47
-
48
-
49
-
50
-
51
-
52
-
53
-
54
-
55
-
56
-
57
-
58
-
59
-
60
-
61
-
62
-
63
-
64
-
65
-
66
-
67
-
68
-
69
-
70
-
71
-
72
-
73
-
74
-
75
-
76
-
77
-
78
-
79
-
80
-
81
-
82
-
83
-
84
-
85
-
86
-
87
-
88
-
89
-
90
-
91
-
92
-
93
-
94
-
95
-
96
-
97
-
98
-
99
-
100
-
101
-
102
-
103
-
104
-
105
-
106
-
107
-
108
-
109
-
110
-
111
-
112
-
113
-
114
-
115
-
116
-
117
-
118
-
119
-
120
-
121
-
122
-
123
-
124
-
125
-
126
-
127
-
128
-
129
-
130
-
131
-
132
-
133
-
134
-
135
-
136
-
 137
137 -
 138
138 -
 139
139 -
 140
140 -
 141
141 -
 142
142 -
 143
143 -
 144
144 -
 145
145 -
 146
146 -
 147
147 -
 148
148 -
 149
149 -
 150
150 -
 151
151 -
 152
152 -
 153
153 -
 154
154 -
 155
155 -
 156
156 -
 157
157 -
158
-
159
-
160
-
161
-
162
-
163
-
164
-
165
-
166
-
167
-
168
-
169
-
170
-
171
-
172
-
173
-
174
-
175
-
176
-
177
-
178
-
179
-
180
-
181
-
182
-
183
-
184
-
185
-
186
-
187
-
188
-
189
-
190
-
191
-
192
-
193
-
194
-
195
-
196
-
197
-
198
-
199
-
200
-
201
-
202
-
203
-
204
-
205
-
206
-
207
-
208
-
209
-
210
-
211
-
212
-
213
-
214
-
215
-
216
-
217
-
218
-
219
-
220
-
221
-
222
-
223
-
224
-
225
-
226
-
227
-
228
-
229
-
230
-
231
-
232
-
233
-
234
-
235
-
236
-
237
-
238
-
239
-
240
-
241
-
242
-
243
-
244
-
245
-
246
-
247
-
248
-
249
-
250
-
251
-
252
-
253
-
254
-
255
-
256
-
257
-
258
-
259
-
260
-
261
-
262
-
263
-
264
-
265
-
266
-
267
-
268
-
269
-
270
-
271
-
272
-
273
-
274
-
275
 |
 |

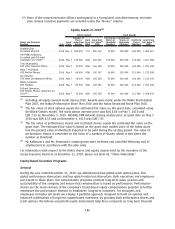
(*) None of the named executive officers participated in a formulated, nondiscretionary, incentive
plan. Annual incentive payments are included under the “Bonus” column.
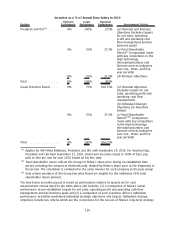
Equity Grants in 2010
(1)
Name and Principal
Position Year
Grant
Date
Number of
Shares
underlying
Options
Grant
Price
(EUR)
Grant Date
Fair Value
(2)
(EUR)
Performance
Shares at
Threshold
(Number)
Performance
Shares at
Maximum
(Number)
Restricted
Shares
(Number)
Grant Date
Fair Value
(3)
(EUR)
Option Awards Stock Awards
Stephen Elop,
President and CEO . ............ 2010 Nov. 5 500 000 7.59 800 132 75 000 300 000 100 000 1 682 607
OlliPekka Kallasvuo,
President and CEO until
September 20, 2010
(4)
.......... 2010 May 7 270 000 8.86 641 551 135 000 540 000 170 000 3 267 288
Timo Ihamuotila,
EVP, Chief Financial Officer ....... 2010 May 7 70 000 8.86 166 328 35 000 140 000 120 000 1 341 568
Mary T. McDowell,
EVP, Mobile Phones ............ 2010 May 7 60 000 8.86 142 567 30 000 120 000 115 000 1 233 368
Kai O
¨ista
¨mo
¨,
EVP, Chief Development Officer . . . . 2010 May 7 70 000 8.86 166 328 35 000 140 000 100 000 1 212 143
Niklas Savander,
EVP,Markets................. 2010 May 7 60 000 8.86 142 567 30 000 120 000 115 000 1 233 368
Richard Simonson,
EVP, Mobile Phones until June 30,
2010
(4)
.................... 2010 May 7 70 000 8.86 166 328 35 000 140 000 111 000 1 508 474
(1)
Including all equity awards made during 2010. Awards were made under the Nokia Stock Option
Plan 2007, the Nokia Performance Share Plan 2010 and the Nokia Restricted Share Plan 2010.
(2)
The fair value of stock options equals the estimated fair value on the grant date, calculated using
the BlackScholes model. The stock option exercise price was EUR 8.86 on May 7, 2010 and
EUR 7.59 on November 5, 2010. NASDAQ OMX Helsinki closing market price at grant date on May 7,
2010 was EUR 8.35 and on November 5, 2010 was EUR 7.65.
(3)
The fair value of performance shares and restricted shares equals the estimated fair value on the
grant date. The estimated fair value is based on the grant date market price of the Nokia share
less the present value of dividends expected to be paid during the vesting period. The value of
performance shares is presented on the basis of a number of shares, which is two times the
number at threshold.
(4)
Mr. Kallasvuo’s and Mr. Simonson’s equity grants were forfeited and cancelled following end of
employment in accordance with the plan rules.
For information with respect to the Nokia shares and equity awards held by the members of the
Group Executive Board as at December 31, 2010, please see Item 6E. “Share Ownership”.
EquityBased Incentive Programs
General
During the year ended December 31, 2010, we administered two global stock option plans, four
global performance share plans and four global restricted share plans. Both executives and employees
participate in these plans. Our compensation programs promote longterm value creation and
sustainability of the company and ensure that remuneration is based on performance. Performance
shares are the main element of the company’s broadbased equity compensation program to further
emphasize the performance element in employees’ longterm incentives. For managers and
employees in higher job levels we employ a portfolio approach designed to build an optimal and
balanced combination of longterm equitybased incentives, by granting both performance shares and
stock options. We believe using both equity instruments help focus recipients on long term financial
146