Nokia 2010 Annual Report Download - page 159
Download and view the complete annual report
Please find page 159 of the 2010 Nokia annual report below. You can navigate through the pages in the report by either clicking on the pages listed below, or by using the keyword search tool below to find specific information within the annual report.-
 1
1 -
2
-
3
-
4
-
5
-
6
-
7
-
8
-
9
-
10
-
11
-
12
-
13
-
14
-
15
-
16
-
17
-
18
-
19
-
20
-
21
-
22
-
23
-
24
-
25
-
26
-
27
-
28
-
29
-
30
-
31
-
32
-
33
-
34
-
35
-
36
-
37
-
38
-
39
-
40
-
41
-
42
-
43
-
44
-
45
-
46
-
47
-
48
-
49
-
50
-
51
-
52
-
53
-
54
-
55
-
56
-
57
-
58
-
59
-
60
-
61
-
62
-
63
-
64
-
65
-
66
-
67
-
68
-
69
-
70
-
71
-
72
-
73
-
74
-
75
-
76
-
77
-
78
-
79
-
80
-
81
-
82
-
83
-
84
-
85
-
86
-
87
-
88
-
89
-
90
-
91
-
92
-
93
-
94
-
95
-
96
-
97
-
98
-
99
-
100
-
101
-
102
-
103
-
104
-
105
-
106
-
107
-
108
-
109
-
110
-
111
-
112
-
113
-
114
-
115
-
116
-
117
-
118
-
119
-
120
-
121
-
122
-
123
-
124
-
125
-
126
-
127
-
128
-
129
-
130
-
131
-
132
-
133
-
134
-
135
-
136
-
137
-
138
-
139
-
140
-
141
-
142
-
143
-
144
-
145
-
146
-
147
-
148
-
 149
149 -
 150
150 -
 151
151 -
 152
152 -
 153
153 -
 154
154 -
 155
155 -
 156
156 -
 157
157 -
 158
158 -
 159
159 -
 160
160 -
 161
161 -
 162
162 -
 163
163 -
 164
164 -
 165
165 -
 166
166 -
 167
167 -
 168
168 -
 169
169 -
170
-
171
-
172
-
173
-
174
-
175
-
176
-
177
-
178
-
179
-
180
-
181
-
182
-
183
-
184
-
185
-
186
-
187
-
188
-
189
-
190
-
191
-
192
-
193
-
194
-
195
-
196
-
197
-
198
-
199
-
200
-
201
-
202
-
203
-
204
-
205
-
206
-
207
-
208
-
209
-
210
-
211
-
212
-
213
-
214
-
215
-
216
-
217
-
218
-
219
-
220
-
221
-
222
-
223
-
224
-
225
-
226
-
227
-
228
-
229
-
230
-
231
-
232
-
233
-
234
-
235
-
236
-
237
-
238
-
239
-
240
-
241
-
242
-
243
-
244
-
245
-
246
-
247
-
248
-
249
-
250
-
251
-
252
-
253
-
254
-
255
-
256
-
257
-
258
-
259
-
260
-
261
-
262
-
263
-
264
-
265
-
266
-
267
-
268
-
269
-
270
-
271
-
272
-
273
-
274
-
275
 |
 |

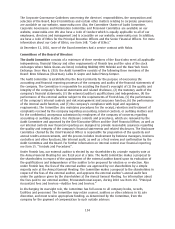
The number of stock options in the above table equals the number of underlying shares
represented by the option entitlement. The intrinsic value of the stock options in the above table
is based on the difference between the exercise price of the options and the closing market price
of Nokia shares on NASDAQ OMX Helsinki as at December 30, 2010 of EUR 7.74.
(4)
Per Karlsson’s holdings include both shares held personally and shares held through a company.
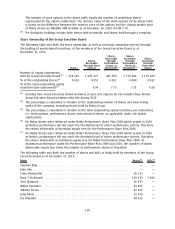
Share Ownership of the Group Executive Board
The following table sets forth the share ownership, as well as potential ownership interest through
the holding of equitybased incentives, of the members of the Group Executive Board as at
December 31, 2010.
Shares
Shares
Receivable
Through Stock
Options
Shares
Receivable
Through
Performance
Shares at
Threshold
(4)
Shares
Receivable
Through
Performance
Shares at
Maximum
(5)
Shares
Receivable
Through
Restricted
Shares
Number of equity instruments
held by Group Executive Board
(1)
. . 524 202 1 943 975 443 500 1 774 000 1 174 000
% of the outstanding shares
(2)
. . . 0.014 0.052 0.012 0.048 0.032
% of the total outstanding equity
incentives (per instrument)
(3)
.... 8.94 7.75 7.75 9.50
(1)
Includes nine Group Executive Board members at year end. Figures do not include those former
Group Executive Board members who left during 2010.
(2)
The percentage is calculated in relation to the outstanding number of shares and total voting
rights of the company, excluding shares held by Nokia Group.
(3)
The percentage is calculated in relation to the total outstanding equity incentives per instrument,
i.e., stock options, performance shares and restricted shares, as applicable, under the global
equity plans.
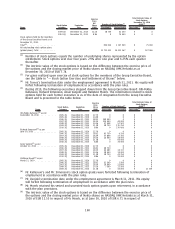
(4)
No Nokia shares were delivered under Nokia Performance Share Plan 2008 which vested in 2010
as Nokia’s performance did not reach the threshold level of either performance criteria. Therefore
the shares deliverable at threshold equals zero for the Performance Share Plan 2008.
(5)
No Nokia shares were delivered under Nokia Performance Share Plan 2008 which vested in 2010
as Nokia’s performance did not reach the threshold level of either performance criteria. Therefore
the shares deliverable at maximum equals zero for Nokia Performance Share Plan 2008. At
maximum performance under the Performance Share Plan 2009 and 2010, the number of shares
deliverable equals four times the number of performance shares at threshold.
The following table sets forth the number of shares and ADSs in Nokia held by members of the Group
Executive Board as of December 31, 2010.
Name Shares
(1)
ADSs
(1)
Stephen Elop ......................................................... — —
EskoAho............................................................ — —
Timo Ihamuotila ...................................................... 56213 —
Mary T. McDowell ..................................................... 169219 5000
Tero Ojanpera
¨........................................................ 66872 —
Niklas Savander ...................................................... 83465 —
Alberto Torres ........................................................ 42832 —
Juha A
¨kra
¨s........................................................... 15976 —
Kai O
¨ista
¨mo
¨......................................................... 84625 —
158