Nokia 2010 Annual Report Download - page 139
Download and view the complete annual report
Please find page 139 of the 2010 Nokia annual report below. You can navigate through the pages in the report by either clicking on the pages listed below, or by using the keyword search tool below to find specific information within the annual report.-
 1
1 -
2
-
3
-
4
-
5
-
6
-
7
-
8
-
9
-
10
-
11
-
12
-
13
-
14
-
15
-
16
-
17
-
18
-
19
-
20
-
21
-
22
-
23
-
24
-
25
-
26
-
27
-
28
-
29
-
30
-
31
-
32
-
33
-
34
-
35
-
36
-
37
-
38
-
39
-
40
-
41
-
42
-
43
-
44
-
45
-
46
-
47
-
48
-
49
-
50
-
51
-
52
-
53
-
54
-
55
-
56
-
57
-
58
-
59
-
60
-
61
-
62
-
63
-
64
-
65
-
66
-
67
-
68
-
69
-
70
-
71
-
72
-
73
-
74
-
75
-
76
-
77
-
78
-
79
-
80
-
81
-
82
-
83
-
84
-
85
-
86
-
87
-
88
-
89
-
90
-
91
-
92
-
93
-
94
-
95
-
96
-
97
-
98
-
99
-
100
-
101
-
102
-
103
-
104
-
105
-
106
-
107
-
108
-
109
-
110
-
111
-
112
-
113
-
114
-
115
-
116
-
117
-
118
-
119
-
120
-
121
-
122
-
123
-
124
-
125
-
126
-
127
-
128
-
 129
129 -
 130
130 -
 131
131 -
 132
132 -
 133
133 -
 134
134 -
 135
135 -
 136
136 -
 137
137 -
 138
138 -
 139
139 -
 140
140 -
 141
141 -
 142
142 -
 143
143 -
 144
144 -
 145
145 -
 146
146 -
 147
147 -
 148
148 -
 149
149 -
150
-
151
-
152
-
153
-
154
-
155
-
156
-
157
-
158
-
159
-
160
-
161
-
162
-
163
-
164
-
165
-
166
-
167
-
168
-
169
-
170
-
171
-
172
-
173
-
174
-
175
-
176
-
177
-
178
-
179
-
180
-
181
-
182
-
183
-
184
-
185
-
186
-
187
-
188
-
189
-
190
-
191
-
192
-
193
-
194
-
195
-
196
-
197
-
198
-
199
-
200
-
201
-
202
-
203
-
204
-
205
-
206
-
207
-
208
-
209
-
210
-
211
-
212
-
213
-
214
-
215
-
216
-
217
-
218
-
219
-
220
-
221
-
222
-
223
-
224
-
225
-
226
-
227
-
228
-
229
-
230
-
231
-
232
-
233
-
234
-
235
-
236
-
237
-
238
-
239
-
240
-
241
-
242
-
243
-
244
-
245
-
246
-
247
-
248
-
249
-
250
-
251
-
252
-
253
-
254
-
255
-
256
-
257
-
258
-
259
-
260
-
261
-
262
-
263
-
264
-
265
-
266
-
267
-
268
-
269
-
270
-
271
-
272
-
273
-
274
-
275
 |
 |

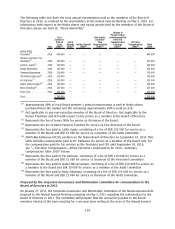
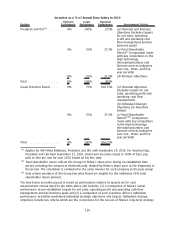
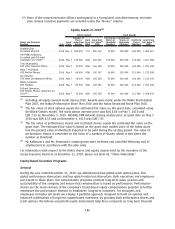
Incentive as a % of Annual Base Salary in 2010
Position
Minimum
Performance
Target
Performance
Maximum
Performance Measurement Criteria
President and CEO
(1)
....... 0% 100% 225%
(a) Financial and Business
Objectives
(includes targets
for net sales, operating
profit and operating cash
flow management and key
business goals)
0% 25% 37.5%
(c) Total Shareholder
Return
(2)
(comparison made
with key competitors in the
high technology,
telecommunications and
Internet services industries
over one, three and five
year periods)
0% 25% 37.5%
(d) Strategic Objectives
Total ................... 0% 150% 300%
Group Executive Board ..... 0% 75% 168.75%
(a) Financial Objectives
(includes targets for net
sales, operating profit and
operating cash flow
management)
(b) Individual Strategic
Objectives
(as described
below)
0% 25% 37.5%
(c) Total Shareholder
Return
(2)(3)
(comparison
made with key competitors
in the high technology,
telecommunications and
Internet services industries
over one, three and five
year periods)
Total ................... 0% 100% 206.25%
(1)
Applies for OlliPekka Kallasvuo, President and CEO until September 20, 2010. For Stephen Elop,
President and CEO from September 21, 2010, shortterm incentive target is 150% of base pay,
paid to him pro rata for year 2010, based on his hire date.
(2)
Total shareholder return reflects the change in Nokia’s share price during an established time
period, including the amount of dividends paid, divided by Nokia’s share price at the beginning of
the period. The calculation is conducted in the same manner for each company in the peer group.
(3)
Only certain members of the Group Executive Board are eligible for the additional 25% total
shareholder return element.
The shortterm incentive payout is based on performance relative to targets set for each
measurement criteria listed in the table above and includes: (1) a comparison of Nokia’s actual
performance to preestablished targets for net sales, operating profit and operating cash flow
management and key business goals and (2) a comparison of each executive officer’s individual
performance to his/her predefined individual strategic objectives and targets. Individual strategic
objectives include key criteria which are the cornerstone for the success of Nokia’s longterm strategy
138