Nokia 2010 Annual Report Download - page 115
Download and view the complete annual report
Please find page 115 of the 2010 Nokia annual report below. You can navigate through the pages in the report by either clicking on the pages listed below, or by using the keyword search tool below to find specific information within the annual report.-
 1
1 -
2
-
3
-
4
-
5
-
6
-
7
-
8
-
9
-
10
-
11
-
12
-
13
-
14
-
15
-
16
-
17
-
18
-
19
-
20
-
21
-
22
-
23
-
24
-
25
-
26
-
27
-
28
-
29
-
30
-
31
-
32
-
33
-
34
-
35
-
36
-
37
-
38
-
39
-
40
-
41
-
42
-
43
-
44
-
45
-
46
-
47
-
48
-
49
-
50
-
51
-
52
-
53
-
54
-
55
-
56
-
57
-
58
-
59
-
60
-
61
-
62
-
63
-
64
-
65
-
66
-
67
-
68
-
69
-
70
-
71
-
72
-
73
-
74
-
75
-
76
-
77
-
78
-
79
-
80
-
81
-
82
-
83
-
84
-
85
-
86
-
87
-
88
-
89
-
90
-
91
-
92
-
93
-
94
-
95
-
96
-
97
-
98
-
99
-
100
-
101
-
102
-
103
-
104
-
 105
105 -
 106
106 -
 107
107 -
 108
108 -
 109
109 -
 110
110 -
 111
111 -
 112
112 -
 113
113 -
 114
114 -
 115
115 -
 116
116 -
 117
117 -
 118
118 -
 119
119 -
 120
120 -
 121
121 -
 122
122 -
 123
123 -
 124
124 -
 125
125 -
126
-
127
-
128
-
129
-
130
-
131
-
132
-
133
-
134
-
135
-
136
-
137
-
138
-
139
-
140
-
141
-
142
-
143
-
144
-
145
-
146
-
147
-
148
-
149
-
150
-
151
-
152
-
153
-
154
-
155
-
156
-
157
-
158
-
159
-
160
-
161
-
162
-
163
-
164
-
165
-
166
-
167
-
168
-
169
-
170
-
171
-
172
-
173
-
174
-
175
-
176
-
177
-
178
-
179
-
180
-
181
-
182
-
183
-
184
-
185
-
186
-
187
-
188
-
189
-
190
-
191
-
192
-
193
-
194
-
195
-
196
-
197
-
198
-
199
-
200
-
201
-
202
-
203
-
204
-
205
-
206
-
207
-
208
-
209
-
210
-
211
-
212
-
213
-
214
-
215
-
216
-
217
-
218
-
219
-
220
-
221
-
222
-
223
-
224
-
225
-
226
-
227
-
228
-
229
-
230
-
231
-
232
-
233
-
234
-
235
-
236
-
237
-
238
-
239
-
240
-
241
-
242
-
243
-
244
-
245
-
246
-
247
-
248
-
249
-
250
-
251
-
252
-
253
-
254
-
255
-
256
-
257
-
258
-
259
-
260
-
261
-
262
-
263
-
264
-
265
-
266
-
267
-
268
-
269
-
270
-
271
-
272
-
273
-
274
-
275
 |
 |

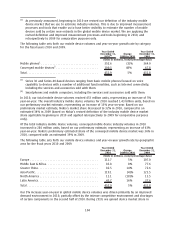
Devices & Services net sales in 2009 decreased 21% to EUR 27 853 million compared with
EUR 35 099 million in 2008. The decline was driven by both volume decline as well as ASP decline. Of
our total Devices & Services net sales, services contributed EUR 607 million in 2009. Net sales in
Devices & Services were down in all regions except Greater China year on year.
Devices & Services gross profit in 2009 was EUR 9 270 million compared with EUR 12 739 million in
2008, a decline of 27%. This represented a gross margin of 33.3% in 2009 compared with a gross
margin of 36.3% in 2008.
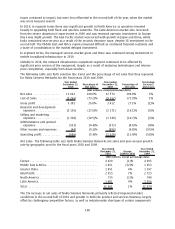
Devices & Services R&D expenses in 2009 decreased 5% to EUR 2 984 million compared with
EUR 3 127 million in 2008. In 2009, R&D expenses represented 10.7% of Devices & Services net sales
compared with 8.9% in 2008. The decrease Devices & Services R&D expenses in 2009 was due to the
measures taken to adjust our business operations and cost base to prevailing market conditions. In
2009, Devices & Services R&D expenses included EUR 8 million amortization of acquired intangible
assets. In 2008, Devices & Services R&D expenses included EUR 153 million representing the
contribution of the assets to the Symbian Foundation.
In 2009, Devices & Services selling and marketing expenses decreased 17% to EUR 2 366 million
compared with EUR 2 847 million in 2008. The decrease was due to the measures taken to adjust our
business operations and cost base to prevailing market conditions. In 2009, selling and marketing
expenses represented 8.5% of Devices & Services net sales compared with 8.1% of its net sales in
2008.
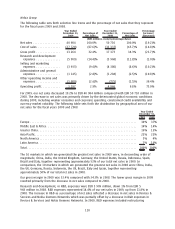
Other operating income and expenses were EUR 189 million in 2009 and included restructuring
charges of EUR 178 million, impairment of assets EUR 56 million and gain on the sale of the security
appliance business of EUR 68 million. In 2008 other operating income and expenses of
EUR 520 million included EUR 392 million of restructuring charges primarily related to the closure of
the Bochum site in Germany.
In 2009, Devices & Services operating profit decreased 43% to EUR 3 314 million compared with
EUR 5 816 million in 2008, with a 11.9% operating margin, down from 16.6% in 2008. The decrease
in operating profit in 2009 was primarily driven by lower net sales compared to 2008 which was
partially offset by the operating expense reductions described above.
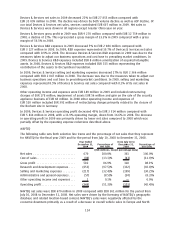
NAVTEQ
The following table sets forth selective line items and the percentage of net sales that they represent
for NAVTEQ for the fiscal year 2009 and for the period from July 10, 2008 to December 31, 2008.
Year Ended
December 31,
2009
Percentage of
Net Sales
From July 10 to
December 31,
2008
Percentage of
Net Sales
(EUR millions, except percentage data)
Net sales .......................... 670 100.0% 361 100.0%
Cost of sales ........................ (88) (13.1)% (43) (11.9)%
Gross profit ........................ 582 86.9% 318 88.1%
Research and development expenses .... (653) (97.5)% (332) (92.0)%
Selling and marketing expenses ........ (217) (32.4)% (109) (30.2)%
Administrative and general expenses .... (57) (8.5)% (30) (8.3)%
Other operating income and expenses . . . 1 0.1% — 0.0%
Operating profit ..................... (344) (51.3)% (153) (42.4)%
NAVTEQ net sales were EUR 670 million in 2009 compared with EUR 361 million for the period from
July 10, 2008 to December 31, 2008. Net sales were driven by the licensing of NAVTEQ’s geographic
database and related locationbased content. NAVTEQ’s sales were negatively affected by the
economic downturn primarily as a result of a decrease in overall vehicle sales in Europe and North
114