Nokia 2010 Annual Report Download - page 218
Download and view the complete annual report
Please find page 218 of the 2010 Nokia annual report below. You can navigate through the pages in the report by either clicking on the pages listed below, or by using the keyword search tool below to find specific information within the annual report.-
 1
1 -
2
-
3
-
4
-
5
-
6
-
7
-
8
-
9
-
10
-
11
-
12
-
13
-
14
-
15
-
16
-
17
-
18
-
19
-
20
-
21
-
22
-
23
-
24
-
25
-
26
-
27
-
28
-
29
-
30
-
31
-
32
-
33
-
34
-
35
-
36
-
37
-
38
-
39
-
40
-
41
-
42
-
43
-
44
-
45
-
46
-
47
-
48
-
49
-
50
-
51
-
52
-
53
-
54
-
55
-
56
-
57
-
58
-
59
-
60
-
61
-
62
-
63
-
64
-
65
-
66
-
67
-
68
-
69
-
70
-
71
-
72
-
73
-
74
-
75
-
76
-
77
-
78
-
79
-
80
-
81
-
82
-
83
-
84
-
85
-
86
-
87
-
88
-
89
-
90
-
91
-
92
-
93
-
94
-
95
-
96
-
97
-
98
-
99
-
100
-
101
-
102
-
103
-
104
-
105
-
106
-
107
-
108
-
109
-
110
-
111
-
112
-
113
-
114
-
115
-
116
-
117
-
118
-
119
-
120
-
121
-
122
-
123
-
124
-
125
-
126
-
127
-
128
-
129
-
130
-
131
-
132
-
133
-
134
-
135
-
136
-
137
-
138
-
139
-
140
-
141
-
142
-
143
-
144
-
145
-
146
-
147
-
148
-
149
-
150
-
151
-
152
-
153
-
154
-
155
-
156
-
157
-
158
-
159
-
160
-
161
-
162
-
163
-
164
-
165
-
166
-
167
-
168
-
169
-
170
-
171
-
172
-
173
-
174
-
175
-
176
-
177
-
178
-
179
-
180
-
181
-
182
-
183
-
184
-
185
-
186
-
187
-
188
-
189
-
190
-
191
-
192
-
193
-
194
-
195
-
196
-
197
-
198
-
199
-
200
-
201
-
202
-
203
-
204
-
205
-
206
-
207
-
 208
208 -
 209
209 -
 210
210 -
 211
211 -
 212
212 -
 213
213 -
 214
214 -
 215
215 -
 216
216 -
 217
217 -
 218
218 -
 219
219 -
 220
220 -
 221
221 -
 222
222 -
 223
223 -
 224
224 -
 225
225 -
 226
226 -
 227
227 -
 228
228 -
229
-
230
-
231
-
232
-
233
-
234
-
235
-
236
-
237
-
238
-
239
-
240
-
241
-
242
-
243
-
244
-
245
-
246
-
247
-
248
-
249
-
250
-
251
-
252
-
253
-
254
-
255
-
256
-
257
-
258
-
259
-
260
-
261
-
262
-
263
-
264
-
265
-
266
-
267
-
268
-
269
-
270
-
271
-
272
-
273
-
274
-
275
 |
 |

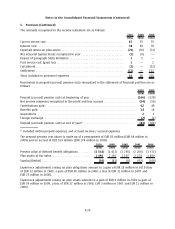
5. Pensions (Continued)
The amounts recognized in the income statement are as follows:
2010 2009 2008
EURm EURm EURm
Current service cost ................................................ 61 55 79
Interest cost ...................................................... 78 69 78
Expected return on plan assets ....................................... (76) (70) (71)
Net actuarial (gains) losses recognized in year ........................... (1) (9) —
Impact of paragraph 58(b) limitation .................................. 35—
Past service cost (gain) loss .......................................... 1—2
Curtailment....................................................... (1) — (12)
Settlement ....................................................... (11) — 152
Total, included in personnel expenses .................................. 54 50 228
Movements in prepaid (accrued) pension costs recognized in the statement of financial position are as
follows:
2010 2009
EURm EURm
Prepaid (accrued) pension costs at beginning of year . ........................... (106) (120)
Net income (expense) recognized in the profit and loss account ................... (54) (50)
Contributions paid ........................................................ 62 49
Benefits paid ............................................................ 14 16
Acquisitions ............................................................. 21
Foreign exchange ........................................................ (2) (2)
Prepaid (accrued) pension costs at end of year* ................................ (84) (106)
* included within prepaid expenses and accrued income / accrued expenses
The prepaid pension cost above is made up of a prepayment of EUR 85 million (EUR 68 million in
2009) and an accrual of EUR 169 million (EUR 174 million in 2009).
2010 2009 2008 2007 2006
EURm EURm EURm EURm EURm
Present value of defined benefit obligations ........ (1 544) (1 411) (1 205) (2 266) (1 577)
Plan assets at fair value ......................... 1 494 1 330 1 197 2 174 1 409
Surplus/(Deficit) ............................... (50) (81) (8) (92) (168)
Experience adjustments arising on plan obligations amount to a gain of EUR 18 million in 2010 (loss
of EUR 12 million in 2009, a gain of EUR 50 million in 2008, a loss of EUR 31 million in 2007 and
EUR 25 million in 2006).
Experience adjustments arising on plan assets amount to a gain of EUR 9 million in 2010 (a gain of
EUR 54 million in 2009, a loss of EUR 22 million in 2008, EUR 3 million in 2007 and EUR 11 million in
2006).
F30
Notes to the Consolidated Financial Statements (Continued)