Nokia 2010 Annual Report Download - page 243
Download and view the complete annual report
Please find page 243 of the 2010 Nokia annual report below. You can navigate through the pages in the report by either clicking on the pages listed below, or by using the keyword search tool below to find specific information within the annual report.-
 1
1 -
2
-
3
-
4
-
5
-
6
-
7
-
8
-
9
-
10
-
11
-
12
-
13
-
14
-
15
-
16
-
17
-
18
-
19
-
20
-
21
-
22
-
23
-
24
-
25
-
26
-
27
-
28
-
29
-
30
-
31
-
32
-
33
-
34
-
35
-
36
-
37
-
38
-
39
-
40
-
41
-
42
-
43
-
44
-
45
-
46
-
47
-
48
-
49
-
50
-
51
-
52
-
53
-
54
-
55
-
56
-
57
-
58
-
59
-
60
-
61
-
62
-
63
-
64
-
65
-
66
-
67
-
68
-
69
-
70
-
71
-
72
-
73
-
74
-
75
-
76
-
77
-
78
-
79
-
80
-
81
-
82
-
83
-
84
-
85
-
86
-
87
-
88
-
89
-
90
-
91
-
92
-
93
-
94
-
95
-
96
-
97
-
98
-
99
-
100
-
101
-
102
-
103
-
104
-
105
-
106
-
107
-
108
-
109
-
110
-
111
-
112
-
113
-
114
-
115
-
116
-
117
-
118
-
119
-
120
-
121
-
122
-
123
-
124
-
125
-
126
-
127
-
128
-
129
-
130
-
131
-
132
-
133
-
134
-
135
-
136
-
137
-
138
-
139
-
140
-
141
-
142
-
143
-
144
-
145
-
146
-
147
-
148
-
149
-
150
-
151
-
152
-
153
-
154
-
155
-
156
-
157
-
158
-
159
-
160
-
161
-
162
-
163
-
164
-
165
-
166
-
167
-
168
-
169
-
170
-
171
-
172
-
173
-
174
-
175
-
176
-
177
-
178
-
179
-
180
-
181
-
182
-
183
-
184
-
185
-
186
-
187
-
188
-
189
-
190
-
191
-
192
-
193
-
194
-
195
-
196
-
197
-
198
-
199
-
200
-
201
-
202
-
203
-
204
-
205
-
206
-
207
-
208
-
209
-
210
-
211
-
212
-
213
-
214
-
215
-
216
-
217
-
218
-
219
-
220
-
221
-
222
-
223
-
224
-
225
-
226
-
227
-
228
-
229
-
230
-
231
-
232
-
 233
233 -
 234
234 -
 235
235 -
 236
236 -
 237
237 -
 238
238 -
 239
239 -
 240
240 -
 241
241 -
 242
242 -
 243
243 -
 244
244 -
 245
245 -
 246
246 -
 247
247 -
 248
248 -
 249
249 -
 250
250 -
 251
251 -
 252
252 -
 253
253 -
254
-
255
-
256
-
257
-
258
-
259
-
260
-
261
-
262
-
263
-
264
-
265
-
266
-
267
-
268
-
269
-
270
-
271
-
272
-
273
-
274
-
275
 |
 |

22. Translation differences
Gross Tax Net Gross Tax Net Gross Tax Net
Translation
differences, EURm
Net investment
hedging, EURm Total, EURm
Balance at December 31, 2007 ................ (204) — (204) 92 (51) 41 (112) (51) (163)
Translation differences:
Currency translation differences . . ............. 595 — 595 — — — 595 — 595
Transfer to profit and loss (financial income and
expense). . ............................ — — — — — — — — —
Net investment hedging:
Net investment hedging gains (losses) . . ........ — — — (123) 32 (91) (123) 32 (91)
Transfer to profit and loss (financial income and
expense). . ............................ — — — — — — — — —
Movements attributable to noncontrolling
interests ............................... — — — — — — — — —
Balance at December 31, 2008 ................ 391 0 391 (31) (19) (50) 360 (19) 341
Translation differences:
Currency translation differences . . ............. (556) 2 (554) — — — (556) 2 (554)
Transfer to profit and loss (financial income and
expense). . ............................ (7) — (7) — — — (7) — (7)
Net investment hedging:
Net investment hedging gains (losses) . . ........ — — — 114 (31) 83 114 (31) 83
Transfer to profit and loss (financial income and
expense). . ............................ — — — 1 — 1 1 — 1
Movements attributable to noncontrolling
interests ............................... 8 1 9 — — — 8 1 9
Balance at December 31, 2009 ................ (164) 3 (161) 84 (50) 34 (80) (47) (127)
Translation differences:
Currency translation differences . . ............. 1302 3 1305 — — — 1302 3 1305
Transfer to profit and loss (financial income and
expense). . ............................ — — — — — — — — —
Net investment hedging:
Net investment hedging gains (losses) . . ........ (389) 101 (288) (389) 101 (288)
Transfer to profit and loss (financial income and
expense). . ............................ — — — — — — — — —
Movements attributable to noncontrolling
interests ............................... (63) (2) (65) — — — (63) (2) (65)
Balance at December 31, 2010 ................ 1075 4 1079 (305) 51 (254) 770 55 825
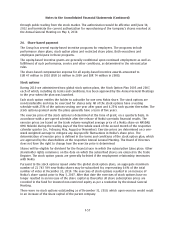
23. The shares of the Parent Company
Nokia shares and shareholders
Shares and share capital
Nokia has one class of shares. Each Nokia share entitles the holder to one vote at General Meetings of
Nokia.
On December 31, 2010, the share capital of Nokia Corporation was EUR 245 896 461.96 and the total
number of shares issued was 3 744 956 052.
On December 31, 2010, the total number of shares included 35 826 052 shares owned by Group
companies representing approximately 1.0% of the share capital and the total voting rights.
Under the Articles of Association of Nokia, Nokia Corporation does not have minimum or maximum
share capital or a par value of a share.
F55
Notes to the Consolidated Financial Statements (Continued)