Nokia 2010 Annual Report Download - page 117
Download and view the complete annual report
Please find page 117 of the 2010 Nokia annual report below. You can navigate through the pages in the report by either clicking on the pages listed below, or by using the keyword search tool below to find specific information within the annual report.-
 1
1 -
2
-
3
-
4
-
5
-
6
-
7
-
8
-
9
-
10
-
11
-
12
-
13
-
14
-
15
-
16
-
17
-
18
-
19
-
20
-
21
-
22
-
23
-
24
-
25
-
26
-
27
-
28
-
29
-
30
-
31
-
32
-
33
-
34
-
35
-
36
-
37
-
38
-
39
-
40
-
41
-
42
-
43
-
44
-
45
-
46
-
47
-
48
-
49
-
50
-
51
-
52
-
53
-
54
-
55
-
56
-
57
-
58
-
59
-
60
-
61
-
62
-
63
-
64
-
65
-
66
-
67
-
68
-
69
-
70
-
71
-
72
-
73
-
74
-
75
-
76
-
77
-
78
-
79
-
80
-
81
-
82
-
83
-
84
-
85
-
86
-
87
-
88
-
89
-
90
-
91
-
92
-
93
-
94
-
95
-
96
-
97
-
98
-
99
-
100
-
101
-
102
-
103
-
104
-
105
-
106
-
 107
107 -
 108
108 -
 109
109 -
 110
110 -
 111
111 -
 112
112 -
 113
113 -
 114
114 -
 115
115 -
 116
116 -
 117
117 -
 118
118 -
 119
119 -
 120
120 -
 121
121 -
 122
122 -
 123
123 -
 124
124 -
 125
125 -
 126
126 -
 127
127 -
128
-
129
-
130
-
131
-
132
-
133
-
134
-
135
-
136
-
137
-
138
-
139
-
140
-
141
-
142
-
143
-
144
-
145
-
146
-
147
-
148
-
149
-
150
-
151
-
152
-
153
-
154
-
155
-
156
-
157
-
158
-
159
-
160
-
161
-
162
-
163
-
164
-
165
-
166
-
167
-
168
-
169
-
170
-
171
-
172
-
173
-
174
-
175
-
176
-
177
-
178
-
179
-
180
-
181
-
182
-
183
-
184
-
185
-
186
-
187
-
188
-
189
-
190
-
191
-
192
-
193
-
194
-
195
-
196
-
197
-
198
-
199
-
200
-
201
-
202
-
203
-
204
-
205
-
206
-
207
-
208
-
209
-
210
-
211
-
212
-
213
-
214
-
215
-
216
-
217
-
218
-
219
-
220
-
221
-
222
-
223
-
224
-
225
-
226
-
227
-
228
-
229
-
230
-
231
-
232
-
233
-
234
-
235
-
236
-
237
-
238
-
239
-
240
-
241
-
242
-
243
-
244
-
245
-
246
-
247
-
248
-
249
-
250
-
251
-
252
-
253
-
254
-
255
-
256
-
257
-
258
-
259
-
260
-
261
-
262
-
263
-
264
-
265
-
266
-
267
-
268
-
269
-
270
-
271
-
272
-
273
-
274
-
275
 |
 |

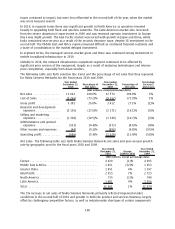
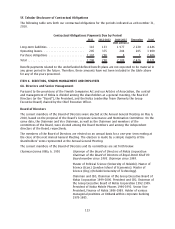
significant price erosion of the equipment, largely as a result of maturing technologies and intense
price competition. The fixed infrastructure market continued to be characterized by intense price
competition in 2009, both in terms of the equipment price erosion due to heavy competition,
especially from Asian vendors, and declining tariffs.
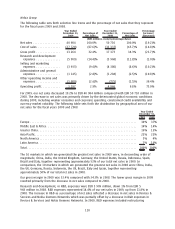
The following table sets forth selective line items and the percentage of net sales that they represent
for Nokia Siemens Networks for the fiscal years 2009 and 2008.
Year Ended
December 31,
2009
Percentage of
Net Sales
Year Ended
December 31,
2008
Percentage of
Net Sales
Percentage
Increase/
(Decrease)
(EUR millions, except percentage data)
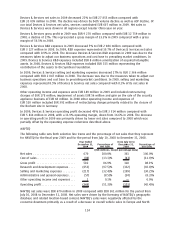
Net sales ................. 12574 100.0% 15 309 100.0% (18)%
Cost of Sales .............. (9162) (72.9)% (10 993) (71.8)% (17)%
Gross profit ............... 3412 27.1% 4 316 28.2% (21)%
Research and development
expenses ............... (2271) (18.1)% (2 500) (16.3)% (9)%
Selling and marketing
expenses ............... (1349) (10.7)% (1 421) (9.3)% (5)%
Administrative and general
expenses ............... (573) (4.6)% (689) (4.5)% (17)%
Other income and expenses . . (858) (6.8)% (7) (0.0)%
Operating profit............ (1639) (13.0)% (301) (2.0)% (445)%
Nokia Siemens Networks’ net sales in 2009 decreased 18% to EUR 12 574 million compared with
EUR 15 309 million in 2008. The decrease in net sales reflected extremely challenging market
conditions with significant investment restraint by our customers in line with the general economic
downturn and competitive factors. At constant currency, Nokia Siemens Networks’ net sales would
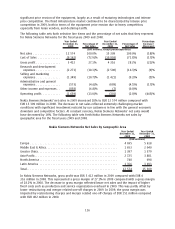
have decreased by 16%. The following table sets forth Nokia Siemens Networks net sales by
geographic area for the fiscal years 2009 and 2008.
Nokia Siemens Networks Net Sales by Geographic Area
Year Ended
December 31,
2009
Year Ended
December 31,
2008
(EUR millions)
Europe ...................................................... 4695 5618
Middle East & Africa............................................ 1653 2040
Greater China ................................................. 1397 1379
AsiaPacific................................................... 2725 3881
North America ................................................ 748 698
Latin America ................................................ 1356 1693
Total........................................................ 12574 15309
In Nokia Siemens Networks, gross profit was EUR 3 412 million in 2009 compared with EUR 4
316 million in 2008. This represented a gross margin of 27.1% in 2009 compared with a gross margin
of 28.2% in 2008. The decrease in gross margin reflected lower net sales and the impact of higher
fixed costs such as production and service organization overhead in 2009. This was partly offset by
lower restructuring and merger related oneoff charges in 2009. In 2009, the gross margin was
impacted by restructuring charges and merger related oneoff charges of EUR 151 million compared
with EUR 402 million in 2008.
116