Nokia 2010 Annual Report Download - page 161
Download and view the complete annual report
Please find page 161 of the 2010 Nokia annual report below. You can navigate through the pages in the report by either clicking on the pages listed below, or by using the keyword search tool below to find specific information within the annual report.-
 1
1 -
2
-
3
-
4
-
5
-
6
-
7
-
8
-
9
-
10
-
11
-
12
-
13
-
14
-
15
-
16
-
17
-
18
-
19
-
20
-
21
-
22
-
23
-
24
-
25
-
26
-
27
-
28
-
29
-
30
-
31
-
32
-
33
-
34
-
35
-
36
-
37
-
38
-
39
-
40
-
41
-
42
-
43
-
44
-
45
-
46
-
47
-
48
-
49
-
50
-
51
-
52
-
53
-
54
-
55
-
56
-
57
-
58
-
59
-
60
-
61
-
62
-
63
-
64
-
65
-
66
-
67
-
68
-
69
-
70
-
71
-
72
-
73
-
74
-
75
-
76
-
77
-
78
-
79
-
80
-
81
-
82
-
83
-
84
-
85
-
86
-
87
-
88
-
89
-
90
-
91
-
92
-
93
-
94
-
95
-
96
-
97
-
98
-
99
-
100
-
101
-
102
-
103
-
104
-
105
-
106
-
107
-
108
-
109
-
110
-
111
-
112
-
113
-
114
-
115
-
116
-
117
-
118
-
119
-
120
-
121
-
122
-
123
-
124
-
125
-
126
-
127
-
128
-
129
-
130
-
131
-
132
-
133
-
134
-
135
-
136
-
137
-
138
-
139
-
140
-
141
-
142
-
143
-
144
-
145
-
146
-
147
-
148
-
149
-
150
-
 151
151 -
 152
152 -
 153
153 -
 154
154 -
 155
155 -
 156
156 -
 157
157 -
 158
158 -
 159
159 -
 160
160 -
 161
161 -
 162
162 -
 163
163 -
 164
164 -
 165
165 -
 166
166 -
 167
167 -
 168
168 -
 169
169 -
 170
170 -
 171
171 -
172
-
173
-
174
-
175
-
176
-
177
-
178
-
179
-
180
-
181
-
182
-
183
-
184
-
185
-
186
-
187
-
188
-
189
-
190
-
191
-
192
-
193
-
194
-
195
-
196
-
197
-
198
-
199
-
200
-
201
-
202
-
203
-
204
-
205
-
206
-
207
-
208
-
209
-
210
-
211
-
212
-
213
-
214
-
215
-
216
-
217
-
218
-
219
-
220
-
221
-
222
-
223
-
224
-
225
-
226
-
227
-
228
-
229
-
230
-
231
-
232
-
233
-
234
-
235
-
236
-
237
-
238
-
239
-
240
-
241
-
242
-
243
-
244
-
245
-
246
-
247
-
248
-
249
-
250
-
251
-
252
-
253
-
254
-
255
-
256
-
257
-
258
-
259
-
260
-
261
-
262
-
263
-
264
-
265
-
266
-
267
-
268
-
269
-
270
-
271
-
272
-
273
-
274
-
275
 |
 |

Name
Stock Option
Category
Expiration
Date
Exercise
Price
per
Share
(EUR) Exercisable Unexercisable Exercisable
(3)
Unexercisable
Number of Stock Options
(1)
Total Intrinsic Value of
Stock Options,
December 31, 2010
(EUR)
(2)
2009 2Q December 31, 2014 11.18 18 750 41 250 0 0
2010 2Q December 31, 2015 8.86 0 70 000 0 0
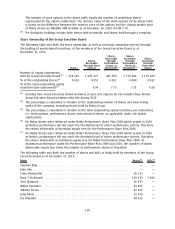
Stock options held by the members
of the Group Executive Board as at
December 31, 2010.
Total
(5)
.................... 696026 1247949 0 75000
All outstanding stock option plans
(global plans), Total . . . ........ 11712432 10031167 0 147096
(1)
Number of stock options equals the number of underlying shares represented by the option
entitlement. Stock options vest over four years: 25% after one year and 6.25% each quarter
thereafter.
(2)
The intrinsic value of the stock options is based on the difference between the exercise price of
the options and the closing market price of Nokia shares on NASDAQ OMX Helsinki as at
December 30, 2010 of EUR 7.74.
(3)
For gains realized upon exercise of stock options for the members of the Group Executive Board,
see the table in “— Stock Option Exercises and Settlement of Shares” below.
(4)
Mr. Torres’s termination date under the employment agreement is March 31, 2011. His equity will
forfeit following termination of employment in accordance with the plan rules.
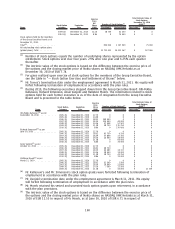
(5)
During 2010, the following executives stepped down from the Group Executive Board: OlliPekka
Kallasvuo, Richard Simonson, Anssi Vanjoki and Hallstein Moerk. The information related to stock
options held for each former executive is as of the date of resignation from the Group Executive
Board and is presented in the table below.
Name
Stock Option
Category
Expiration
Date
Exercise
Price
Share
(EUR) Exercisable Unexercisable Exercisable
(3)
Unexercisable
Number of Stock Options
(1)
Total Intrinsic Value of
Stock Options,
(EUR)
(9)
OlliPekka Kallasvuo
(6)
as per
September 20, 2010 . . . ......... 2005 2Q December 31, 2010 12.79 0 0 0 0
2005 4Q December 31, 2010 14.48 0 0 0 0
2006 2Q December 31, 2011 18.02 300 000 0 0 0
2007 2Q December 31, 2012 18.39 120 000 40 000 0 0
2008 2Q December 31, 2013 19.16 57 498 57 502 0 0
2009 2Q December 31, 2014 11.18 58 750 176 250 0 0
2010 2Q December 31, 2015 8.86 0 270 000 0 0
Richard Simonson
(6)
as per
June 30, 2010 . . .............. 2005 2Q December 31, 2010 12.79 0 0 0 0
2006 2Q December 31, 2011 18.02 93 750 6 250 0 0
2007 2Q December 31, 2012 18.39 37 809 17 191 0 0
2008 2Q December 31, 2013 19.16 14 000 18 000 0 0
2009 2Q December 31, 2014 11.18 0 60 000 0 0
2010 2Q December 31, 2015 8.86 0 70 000 0 0
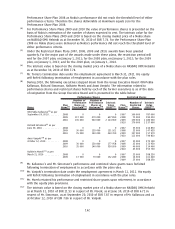
Anssi Vanjoki
(7)
as per
October 12, 2010 .............. 2005 2Q December 31, 2010 12.79 0 0 0 0
2006 2Q December 31, 2011 18.02 68 750 0 0 0
2007 2Q December 31, 2012 18.39 44 683 10 317 0 0
2008 2Q December 31, 2013 19.16 18 000 14 000 0 0
2009 2Q December 31, 2014 11.18 18 750 41 250 0 0
2010 2Q December 31, 2015 8.86 0 70 000 0 0
Hallstein Moerk
(8)
as per
March 31, 2010 . .............. 2005 2Q December 31, 2010 12.79 0 0 0 0
2006 2Q December 31, 2011 18.02 52 500 7 500 0 0
2007 2Q December 31, 2012 18.39 20 000 12 000 0 0
2008 2Q December 31, 2013 19.16 7 500 12 500 0 0
2009 2Q December 31, 2014 11.18 0 35 000 0 12 250
(6)
Mr. Kallasvuo’s and Mr. Simonson’s stock option grants were forfeited following termination of
employment in accordance with the plan rules.
(7)
Mr. Vanjoki’s termination date under the employment agreement is March 11, 2011. His equity
will forfeit following termination of employment in accordance with the plan rules.
(8)
Mr. Moerk retained his vested and unvested stock option grants upon retirement, in accordance
with the plan provisions.
(9)
The intrinsic value of the stock options is based on the difference between the exercise price of
the options and the closing market price of Nokia shares on NASDAQ OMX Helsinki as at March 31,
2010 of EUR 11.53 in respect of Mr. Moerk, as at June 30, 2010 of EUR 6.71 in respect of
160