Nokia 2010 Annual Report Download - page 104
Download and view the complete annual report
Please find page 104 of the 2010 Nokia annual report below. You can navigate through the pages in the report by either clicking on the pages listed below, or by using the keyword search tool below to find specific information within the annual report.-
 1
1 -
2
-
3
-
4
-
5
-
6
-
7
-
8
-
9
-
10
-
11
-
12
-
13
-
14
-
15
-
16
-
17
-
18
-
19
-
20
-
21
-
22
-
23
-
24
-
25
-
26
-
27
-
28
-
29
-
30
-
31
-
32
-
33
-
34
-
35
-
36
-
37
-
38
-
39
-
40
-
41
-
42
-
43
-
44
-
45
-
46
-
47
-
48
-
49
-
50
-
51
-
52
-
53
-
54
-
55
-
56
-
57
-
58
-
59
-
60
-
61
-
62
-
63
-
64
-
65
-
66
-
67
-
68
-
69
-
70
-
71
-
72
-
73
-
74
-
75
-
76
-
77
-
78
-
79
-
80
-
81
-
82
-
83
-
84
-
85
-
86
-
87
-
88
-
89
-
90
-
91
-
92
-
93
-
 94
94 -
 95
95 -
 96
96 -
 97
97 -
 98
98 -
 99
99 -
 100
100 -
 101
101 -
 102
102 -
 103
103 -
 104
104 -
 105
105 -
 106
106 -
 107
107 -
 108
108 -
 109
109 -
 110
110 -
 111
111 -
 112
112 -
 113
113 -
 114
114 -
115
-
116
-
117
-
118
-
119
-
120
-
121
-
122
-
123
-
124
-
125
-
126
-
127
-
128
-
129
-
130
-
131
-
132
-
133
-
134
-
135
-
136
-
137
-
138
-
139
-
140
-
141
-
142
-
143
-
144
-
145
-
146
-
147
-
148
-
149
-
150
-
151
-
152
-
153
-
154
-
155
-
156
-
157
-
158
-
159
-
160
-
161
-
162
-
163
-
164
-
165
-
166
-
167
-
168
-
169
-
170
-
171
-
172
-
173
-
174
-
175
-
176
-
177
-
178
-
179
-
180
-
181
-
182
-
183
-
184
-
185
-
186
-
187
-
188
-
189
-
190
-
191
-
192
-
193
-
194
-
195
-
196
-
197
-
198
-
199
-
200
-
201
-
202
-
203
-
204
-
205
-
206
-
207
-
208
-
209
-
210
-
211
-
212
-
213
-
214
-
215
-
216
-
217
-
218
-
219
-
220
-
221
-
222
-
223
-
224
-
225
-
226
-
227
-
228
-
229
-
230
-
231
-
232
-
233
-
234
-
235
-
236
-
237
-
238
-
239
-
240
-
241
-
242
-
243
-
244
-
245
-
246
-
247
-
248
-
249
-
250
-
251
-
252
-
253
-
254
-
255
-
256
-
257
-
258
-
259
-
260
-
261
-
262
-
263
-
264
-
265
-
266
-
267
-
268
-
269
-
270
-
271
-
272
-
273
-
274
-
275
 |
 |

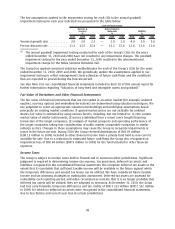
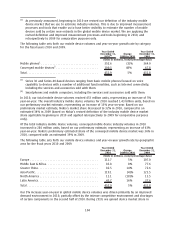
Net Sales.
The following table sets forth our Devices & Services net sales and yearonyear growth
rate by category for the fiscal years 2010 and 2009.
Year Ended
December 31,
2010
Change
2009 to 2010
3
Year Ended
December 31,
2009
3
(EUR millions, except percentage data)
Mobile phones
1
.................................. 14347 (5)% 15126
Converged mobile devices
2
......................... 14786 17% 12676
Total .......................................... 29133 5% 27802
(1)
Series 30 and Series 40based devices ranging from basic mobile phones focused on voice
capability to devices with a number of additional functionalities, such as Internet connectivity,
including the services and accessories sold with them.
(2)
Smartphones and mobile computers, including the services and accessories sold with them.
(3)
Does not include the net sales of the security appliance business that was divested in April 2009.
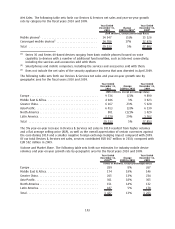
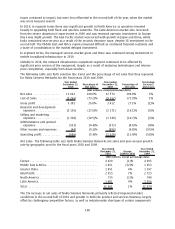
The following table sets forth our Devices & Services net sales and yearonyear growth rate by
geographic area for the fiscal years 2010 and 2009.
Year Ended
December 31,
2010
Change
2009 to 2010
Year Ended
December 31,
2009
(EUR millions, except percentage data)
Europe .......................................... 9736 (2)% 9890
Middle East & Africa ................................ 4046 3% 3923
Greater China ..................................... 6167 23% 5028
AsiaPacific. . ..................................... 6013 (3)% 6230
North America .................................... 901 (12)% 1020
Latin America..................................... 2270 29% 1762
Total ........................................... 29133 5% 27853
The 5% yearonyear increase in Devices & Services net sales in 2010 resulted from higher volumes
and a flat average selling price (ASP), as well as the overall appreciation of certain currencies against
the euro during 2010 and a smaller negative foreign exchange hedging impact compared with 2009.
Of our total Devices & Services net sales, services contributed EUR 667 million in 2010, compared with
EUR 592 million in 2009.
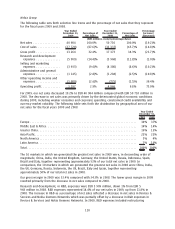
Volume and Market Share.
The following table sets forth our estimates for industry mobile device
volumes and yearonyear growth rate by geographic area for the fiscal years 2010 and 2009.
Year Ended
December 31,
2010
(1)
Change
2009 to 2010
Year Ended
December 31,
2009
(Units in millions, except percentage data)
Europe .......................................... 289 8% 267
Middle East & Africa ................................ 174 19% 146
Greater China ..................................... 265 13% 234
AsiaPacific. . ..................................... 361 18% 305
North America .................................... 151 14% 132
Latin America..................................... 187 5% 178
Total ............................................ 1427 13% 1263
103