Nokia 2010 Annual Report Download - page 241
Download and view the complete annual report
Please find page 241 of the 2010 Nokia annual report below. You can navigate through the pages in the report by either clicking on the pages listed below, or by using the keyword search tool below to find specific information within the annual report.-
 1
1 -
2
-
3
-
4
-
5
-
6
-
7
-
8
-
9
-
10
-
11
-
12
-
13
-
14
-
15
-
16
-
17
-
18
-
19
-
20
-
21
-
22
-
23
-
24
-
25
-
26
-
27
-
28
-
29
-
30
-
31
-
32
-
33
-
34
-
35
-
36
-
37
-
38
-
39
-
40
-
41
-
42
-
43
-
44
-
45
-
46
-
47
-
48
-
49
-
50
-
51
-
52
-
53
-
54
-
55
-
56
-
57
-
58
-
59
-
60
-
61
-
62
-
63
-
64
-
65
-
66
-
67
-
68
-
69
-
70
-
71
-
72
-
73
-
74
-
75
-
76
-
77
-
78
-
79
-
80
-
81
-
82
-
83
-
84
-
85
-
86
-
87
-
88
-
89
-
90
-
91
-
92
-
93
-
94
-
95
-
96
-
97
-
98
-
99
-
100
-
101
-
102
-
103
-
104
-
105
-
106
-
107
-
108
-
109
-
110
-
111
-
112
-
113
-
114
-
115
-
116
-
117
-
118
-
119
-
120
-
121
-
122
-
123
-
124
-
125
-
126
-
127
-
128
-
129
-
130
-
131
-
132
-
133
-
134
-
135
-
136
-
137
-
138
-
139
-
140
-
141
-
142
-
143
-
144
-
145
-
146
-
147
-
148
-
149
-
150
-
151
-
152
-
153
-
154
-
155
-
156
-
157
-
158
-
159
-
160
-
161
-
162
-
163
-
164
-
165
-
166
-
167
-
168
-
169
-
170
-
171
-
172
-
173
-
174
-
175
-
176
-
177
-
178
-
179
-
180
-
181
-
182
-
183
-
184
-
185
-
186
-
187
-
188
-
189
-
190
-
191
-
192
-
193
-
194
-
195
-
196
-
197
-
198
-
199
-
200
-
201
-
202
-
203
-
204
-
205
-
206
-
207
-
208
-
209
-
210
-
211
-
212
-
213
-
214
-
215
-
216
-
217
-
218
-
219
-
220
-
221
-
222
-
223
-
224
-
225
-
226
-
227
-
228
-
229
-
230
-
 231
231 -
 232
232 -
 233
233 -
 234
234 -
 235
235 -
 236
236 -
 237
237 -
 238
238 -
 239
239 -
 240
240 -
 241
241 -
 242
242 -
 243
243 -
 244
244 -
 245
245 -
 246
246 -
 247
247 -
 248
248 -
 249
249 -
 250
250 -
 251
251 -
252
-
253
-
254
-
255
-
256
-
257
-
258
-
259
-
260
-
261
-
262
-
263
-
264
-
265
-
266
-
267
-
268
-
269
-
270
-
271
-
272
-
273
-
274
-
275
 |
 |

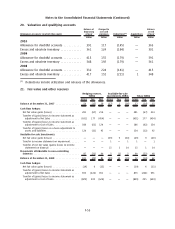
20. Valuation and qualifying accounts
Allowances on assets to which they apply:
Balance at
beginning
of year
Charged to
cost and
expenses Deductions
(1)
Acquisitions
Balance
at end
of year
EURm EURm EURm EURm EURm
2010
Allowance for doubtful accounts ........... 391 117 (145) — 363
Excess and obsolete inventory ............. 361 124 (184) — 301
2009
Allowance for doubtful accounts ........... 415 155 (179) — 391
Excess and obsolete inventory ............. 348 192 (179) — 361
2008
Allowance for doubtful accounts ........... 332 224 (141) — 415
Excess and obsolete inventory ............. 417 151 (221) 1 348
(1)
Deductions include utilization and releases of the allowances.
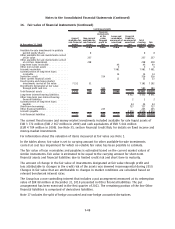
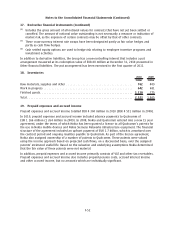
21. Fair value and other reserves
Gross Tax Net Gross Tax Net Gross Tax Net
Hedging reserve,
EURm
Availableforsale
investments, EURm Total, EURm
Balance at December 31, 2007 ................ 54 (15) 39 (17) 1 (16) 37 (14) 23
Cash flow hedges:
Net fair value gains (losses) .................. 281 (67) 214 — — — 281 (67) 214
Transfer of (gains) losses to income statement as
adjustment to Net Sales . .................. (631) 177 (454) — — — (631) 177 (454)
Transfer of (gains) losses to income statement as
adjustment to Cost of Sales ................. 186 (62) 124 — — — 186 (62) 124
Transfer of (gains) losses as a basis adjustment to
assets and liabilities ...................... 124 (32) 92 — — — 124 (32) 92
Availableforsale Investments:
Net fair value gains (losses) .................. — — — (29) 9 (20) (29) 9 (20)
Transfer to income statement on impairment . . . . . . — — — 1 — 1 1 — 1
Transfer of net fair value (gains) losses to income
statement on disposal . . .................. — — — 13 1 14 13 1 14
Movements attributable to noncontrolling
interests ............................... 87 (21) 66 3 (1) 2 90 (22) 68
Balance at December 31, 2008 ................ 101 (20) 81 (29) 10 (19) 72 (10) 62
Cash flow hedges:
Net fair value gains (losses) .................. (19) 6 (13) — — — (19) 6 (13)
Transfer of (gains) losses to income statement as
adjustment to Net Sales . .................. 873 (222) 651 — — — 873 (222) 651
Transfer of (gains) losses to income statement as
adjustment to Cost of Sales ................. (829) 205 (624) — — — (829) 205 (624)
F53
Notes to the Consolidated Financial Statements (Continued)