Nokia 2010 Annual Report Download - page 237
Download and view the complete annual report
Please find page 237 of the 2010 Nokia annual report below. You can navigate through the pages in the report by either clicking on the pages listed below, or by using the keyword search tool below to find specific information within the annual report.-
 1
1 -
2
-
3
-
4
-
5
-
6
-
7
-
8
-
9
-
10
-
11
-
12
-
13
-
14
-
15
-
16
-
17
-
18
-
19
-
20
-
21
-
22
-
23
-
24
-
25
-
26
-
27
-
28
-
29
-
30
-
31
-
32
-
33
-
34
-
35
-
36
-
37
-
38
-
39
-
40
-
41
-
42
-
43
-
44
-
45
-
46
-
47
-
48
-
49
-
50
-
51
-
52
-
53
-
54
-
55
-
56
-
57
-
58
-
59
-
60
-
61
-
62
-
63
-
64
-
65
-
66
-
67
-
68
-
69
-
70
-
71
-
72
-
73
-
74
-
75
-
76
-
77
-
78
-
79
-
80
-
81
-
82
-
83
-
84
-
85
-
86
-
87
-
88
-
89
-
90
-
91
-
92
-
93
-
94
-
95
-
96
-
97
-
98
-
99
-
100
-
101
-
102
-
103
-
104
-
105
-
106
-
107
-
108
-
109
-
110
-
111
-
112
-
113
-
114
-
115
-
116
-
117
-
118
-
119
-
120
-
121
-
122
-
123
-
124
-
125
-
126
-
127
-
128
-
129
-
130
-
131
-
132
-
133
-
134
-
135
-
136
-
137
-
138
-
139
-
140
-
141
-
142
-
143
-
144
-
145
-
146
-
147
-
148
-
149
-
150
-
151
-
152
-
153
-
154
-
155
-
156
-
157
-
158
-
159
-
160
-
161
-
162
-
163
-
164
-
165
-
166
-
167
-
168
-
169
-
170
-
171
-
172
-
173
-
174
-
175
-
176
-
177
-
178
-
179
-
180
-
181
-
182
-
183
-
184
-
185
-
186
-
187
-
188
-
189
-
190
-
191
-
192
-
193
-
194
-
195
-
196
-
197
-
198
-
199
-
200
-
201
-
202
-
203
-
204
-
205
-
206
-
207
-
208
-
209
-
210
-
211
-
212
-
213
-
214
-
215
-
216
-
217
-
218
-
219
-
220
-
221
-
222
-
223
-
224
-
225
-
226
-
 227
227 -
 228
228 -
 229
229 -
 230
230 -
 231
231 -
 232
232 -
 233
233 -
 234
234 -
 235
235 -
 236
236 -
 237
237 -
 238
238 -
 239
239 -
 240
240 -
 241
241 -
 242
242 -
 243
243 -
 244
244 -
 245
245 -
 246
246 -
 247
247 -
248
-
249
-
250
-
251
-
252
-
253
-
254
-
255
-
256
-
257
-
258
-
259
-
260
-
261
-
262
-
263
-
264
-
265
-
266
-
267
-
268
-
269
-
270
-
271
-
272
-
273
-
274
-
275
 |
 |

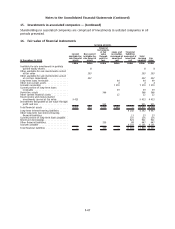
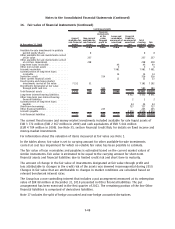
16. Fair value of financial instruments (Continued)
The following table presents the valuation methods used to determine fair values of financial
instruments carried at fair value:
At December 31, 2010
Instruments
with quoted
prices in active
markets
(Level 1)
Valuation
technique
using
observable
data
(Level 2)
Valuation
technique
using non
observable
data
(Level 3) Total
EURm EURm EURm EURm
Fixed income and moneymarket investments
carried at fair value ........................ 9215 198 — 9413
Investments at fair value through profit and loss . . 911 — — 911
Availableforsale investments in publicly quoted
equity shares ............................. 8 — — 8
Other availableforsale investments carried at fair
value.................................... — 14 279 293
Derivative assets ............................ — 366 — 366
Total assets ................................ 10134 578 279 10991
Derivative liabilities .......................... — 359 — 359
Total liabilities .............................. — 359 — 359
At December 31, 2009
Instruments
with quoted
prices in active
markets
(Level 1)
Valuation
technique
using
observable
data
(Level 2)
Valuation
technique
using non
observable
data
(Level 3) Total
EURm EURm EURm EURm
Fixed income and moneymarket investments
carried at fair value . ........................ 6933 249 — 7182
Investments at fair value through profit and loss . . . 580 — — 580
Availableforsale investments in publicly quoted
equity shares .............................. 8 — — 8
Other availableforsale investments carried at fair
value..................................... — 15 242 257
Derivative assets ............................. — 316 — 316
Total assets ................................. 7521 580 242 8343
Derivative liabilities . . . ........................ — 245 — 245
Total liabilities ............................... — 245 — 245
Level 1 category includes financial assets and liabilities that are measured in whole or in significant
part by reference to published quotes in an active market. A financial instrument is regarded as
quoted in an active market if quoted prices are readily and regularly available from an exchange,
dealer, broker, industry group, pricing service or regulatory agency and those prices represent actual
and regularly occurring market transactions on an arm’s length basis. This category includes listed
bonds and other securities, listed shares and exchange traded derivatives.
Level 2 category includes financial assets and liabilities measured using a valuation technique based
on assumptions that are supported by prices from observable current market transactions. These
F49
Notes to the Consolidated Financial Statements (Continued)