Nokia 2010 Annual Report Download - page 101
Download and view the complete annual report
Please find page 101 of the 2010 Nokia annual report below. You can navigate through the pages in the report by either clicking on the pages listed below, or by using the keyword search tool below to find specific information within the annual report.-
 1
1 -
2
-
3
-
4
-
5
-
6
-
7
-
8
-
9
-
10
-
11
-
12
-
13
-
14
-
15
-
16
-
17
-
18
-
19
-
20
-
21
-
22
-
23
-
24
-
25
-
26
-
27
-
28
-
29
-
30
-
31
-
32
-
33
-
34
-
35
-
36
-
37
-
38
-
39
-
40
-
41
-
42
-
43
-
44
-
45
-
46
-
47
-
48
-
49
-
50
-
51
-
52
-
53
-
54
-
55
-
56
-
57
-
58
-
59
-
60
-
61
-
62
-
63
-
64
-
65
-
66
-
67
-
68
-
69
-
70
-
71
-
72
-
73
-
74
-
75
-
76
-
77
-
78
-
79
-
80
-
81
-
82
-
83
-
84
-
85
-
86
-
87
-
88
-
89
-
90
-
 91
91 -
 92
92 -
 93
93 -
 94
94 -
 95
95 -
 96
96 -
 97
97 -
 98
98 -
 99
99 -
 100
100 -
 101
101 -
 102
102 -
 103
103 -
 104
104 -
 105
105 -
 106
106 -
 107
107 -
 108
108 -
 109
109 -
 110
110 -
 111
111 -
112
-
113
-
114
-
115
-
116
-
117
-
118
-
119
-
120
-
121
-
122
-
123
-
124
-
125
-
126
-
127
-
128
-
129
-
130
-
131
-
132
-
133
-
134
-
135
-
136
-
137
-
138
-
139
-
140
-
141
-
142
-
143
-
144
-
145
-
146
-
147
-
148
-
149
-
150
-
151
-
152
-
153
-
154
-
155
-
156
-
157
-
158
-
159
-
160
-
161
-
162
-
163
-
164
-
165
-
166
-
167
-
168
-
169
-
170
-
171
-
172
-
173
-
174
-
175
-
176
-
177
-
178
-
179
-
180
-
181
-
182
-
183
-
184
-
185
-
186
-
187
-
188
-
189
-
190
-
191
-
192
-
193
-
194
-
195
-
196
-
197
-
198
-
199
-
200
-
201
-
202
-
203
-
204
-
205
-
206
-
207
-
208
-
209
-
210
-
211
-
212
-
213
-
214
-
215
-
216
-
217
-
218
-
219
-
220
-
221
-
222
-
223
-
224
-
225
-
226
-
227
-
228
-
229
-
230
-
231
-
232
-
233
-
234
-
235
-
236
-
237
-
238
-
239
-
240
-
241
-
242
-
243
-
244
-
245
-
246
-
247
-
248
-
249
-
250
-
251
-
252
-
253
-
254
-
255
-
256
-
257
-
258
-
259
-
260
-
261
-
262
-
263
-
264
-
265
-
266
-
267
-
268
-
269
-
270
-
271
-
272
-
273
-
274
-
275
 |
 |

if any, an employee ultimately receives from sharebased payment awards may not correspond to the
expense amounts recorded by the Group.
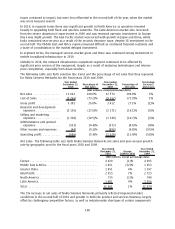
Results of Operations
2010 compared with 2009
Nokia Group
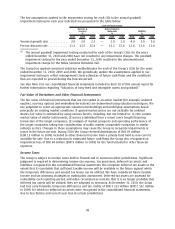
The following table sets forth selective line items and the percentage of net sales that they represent
for the fiscal years 2010 and 2009.
Year Ended
December 31,
2010
Percentage of
Net Sales
Year Ended
December 31,
2009
Percentage of
Net Sales
Percentage
Increase/
(Decrease)
(EUR millions, except percentage data)
Net sales . . .............. 42446 100.0% 40 984 100.0% 4%
Cost of sales ............. (29629) (69.8)% (27 720) (67.6)% 7%
Gross profit .............. 12817 30.2% 13 264 32.4% (3)%
Research and development
expenses .............. (5863) (13.8)% (5 909) (14.4)% (1)%
Selling and marketing
expenses .............. (3877) (9.1)% (3 933) (9.6)% (1)%
Administrative and general
expenses .............. (1115) (2.6)% (1 145) (2.8)% (3)%
Other operating income and
expenses .............. 108 0.3% (1 080) (2.6)%
Operating profit . ......... 2070 4.9% 1 197 2.9% 73%
Net Sales.
For 2010, our net sales and profitability benefited from improved economic and financial
conditions following the significant deterioration in demand during the second half of 2008 and
2009. In 2010, we saw volume and value growth in the global mobile device market driven by rapid
growth in smartphones. At the same time, the competitive environment in mobile devices intensified,
adversely impacting our competitive position in the market. Our device volumes were also adversely
affected in the second half of 2010 by shortages of certain components, which we expect to continue
to impact our business at least through the end of the first quarter 2011. For NAVTEQ and Nokia
Siemens Networks, the demand environment improved in 2010. The overall appreciation of certain
currencies relative to the euro during 2010 had a positive effect on our net sales.
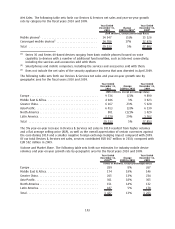
The following table sets forth the distribution by geographical area of our net sales for the fiscal
years 2010 and 2009.
2010 2009
Year Ended
December 31,
Europe................................................................ 34% 36%
Middle East & Africa ..................................................... 13% 14%
Greater China .......................................................... 18% 16%
AsiaPacific ............................................................ 21% 22%
North America.......................................................... 5% 5%
Latin America .......................................................... 9% 7%
Total ................................................................. 100% 100%
100