Nokia 2010 Annual Report Download - page 215
Download and view the complete annual report
Please find page 215 of the 2010 Nokia annual report below. You can navigate through the pages in the report by either clicking on the pages listed below, or by using the keyword search tool below to find specific information within the annual report.-
 1
1 -
2
-
3
-
4
-
5
-
6
-
7
-
8
-
9
-
10
-
11
-
12
-
13
-
14
-
15
-
16
-
17
-
18
-
19
-
20
-
21
-
22
-
23
-
24
-
25
-
26
-
27
-
28
-
29
-
30
-
31
-
32
-
33
-
34
-
35
-
36
-
37
-
38
-
39
-
40
-
41
-
42
-
43
-
44
-
45
-
46
-
47
-
48
-
49
-
50
-
51
-
52
-
53
-
54
-
55
-
56
-
57
-
58
-
59
-
60
-
61
-
62
-
63
-
64
-
65
-
66
-
67
-
68
-
69
-
70
-
71
-
72
-
73
-
74
-
75
-
76
-
77
-
78
-
79
-
80
-
81
-
82
-
83
-
84
-
85
-
86
-
87
-
88
-
89
-
90
-
91
-
92
-
93
-
94
-
95
-
96
-
97
-
98
-
99
-
100
-
101
-
102
-
103
-
104
-
105
-
106
-
107
-
108
-
109
-
110
-
111
-
112
-
113
-
114
-
115
-
116
-
117
-
118
-
119
-
120
-
121
-
122
-
123
-
124
-
125
-
126
-
127
-
128
-
129
-
130
-
131
-
132
-
133
-
134
-
135
-
136
-
137
-
138
-
139
-
140
-
141
-
142
-
143
-
144
-
145
-
146
-
147
-
148
-
149
-
150
-
151
-
152
-
153
-
154
-
155
-
156
-
157
-
158
-
159
-
160
-
161
-
162
-
163
-
164
-
165
-
166
-
167
-
168
-
169
-
170
-
171
-
172
-
173
-
174
-
175
-
176
-
177
-
178
-
179
-
180
-
181
-
182
-
183
-
184
-
185
-
186
-
187
-
188
-
189
-
190
-
191
-
192
-
193
-
194
-
195
-
196
-
197
-
198
-
199
-
200
-
201
-
202
-
203
-
204
-
 205
205 -
 206
206 -
 207
207 -
 208
208 -
 209
209 -
 210
210 -
 211
211 -
 212
212 -
 213
213 -
 214
214 -
 215
215 -
 216
216 -
 217
217 -
 218
218 -
 219
219 -
 220
220 -
 221
221 -
 222
222 -
 223
223 -
 224
224 -
 225
225 -
226
-
227
-
228
-
229
-
230
-
231
-
232
-
233
-
234
-
235
-
236
-
237
-
238
-
239
-
240
-
241
-
242
-
243
-
244
-
245
-
246
-
247
-
248
-
249
-
250
-
251
-
252
-
253
-
254
-
255
-
256
-
257
-
258
-
259
-
260
-
261
-
262
-
263
-
264
-
265
-
266
-
267
-
268
-
269
-
270
-
271
-
272
-
273
-
274
-
275
 |
 |

2. Segment information (Continued)
Net sales to external customers by geographic area by location of customer 2010 2009 2008
EURm EURm EURm
Finland .................................................. 371 390 362
China ................................................... 7 149 5 990 5 916
India.................................................... 2 952 2 809 3 719
Germany................................................. 2 019 1 733 2 294
Russia................................................... 1 744 1 528 2 083
USA..................................................... 1 630 1 731 1 907
Brazil ................................................... 1 506 1 333 1 902
UK...................................................... 1 470 1 916 2 382
Other ................................................... 23 605 23 554 30 145
Total .................................................... 42 446 40 984 50 710
Segment noncurrent assets by geographic area
(8)
2010 2009
EURm EURm
Finland ................................................... 1 501 1 698
China .................................................... 402 358
India ..................................................... 210 180
Germany .................................................. 209 243
USA...................................................... 6 079 5 859
UK....................................................... 236 228
Other .................................................... 1008 1 377
Total ..................................................... 9 645 9 943
(8)
Comprises intangible assets and property, plant and equipment.
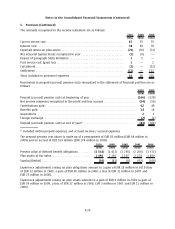
3. Percentage of completion
Contract sales recognized under percentage of completion accounting were EUR 5 094 million in 2010
(EUR 6 868 million in 2009 and EUR 9 220 million in 2008). Services revenue for managed services
and network maintenance contracts were EUR 2 924 million in 2010 (EUR 2 607 million in 2009 and
EUR 2 530 million in 2008).
Included in accrued expenses and other liabilities were advances received related to construction
contracts of EUR 161 million at December 31, 2010 (EUR 126 million in 2009). Included in accounts
receivable were contract revenues recorded prior to billings of EUR 1 326 million at December 31,
2010 (EUR 1 396 million in 2009) and billing in excess of costs incurred of EUR 510 million at
December 31, 2010 (EUR 451 million in 2009).
The aggregate amount of costs incurred and recognized profits (net of recognized losses) under open
construction contracts in progress since inception was EUR 17 262 million in 2010 (EUR 15 351 million
in 2009).
Retentions related to construction contracts, included in accounts receivable, were EUR 207 million at
December 31, 2010 (EUR 265 million at December 31, 2009).
F27
Notes to the Consolidated Financial Statements (Continued)