MoneyGram 2008 Annual Report Download - page 94
Download and view the complete annual report
Please find page 94 of the 2008 MoneyGram annual report below. You can navigate through the pages in the report by either clicking on the pages listed below, or by using the keyword search tool below to find specific information within the annual report.-
 1
1 -
2
-
3
-
4
-
5
-
6
-
7
-
8
-
9
-
10
-
11
-
12
-
13
-
14
-
15
-
16
-
17
-
18
-
19
-
20
-
21
-
22
-
23
-
24
-
25
-
26
-
27
-
28
-
29
-
30
-
31
-
32
-
33
-
34
-
35
-
36
-
37
-
38
-
39
-
40
-
41
-
42
-
43
-
44
-
45
-
46
-
47
-
48
-
49
-
50
-
51
-
52
-
53
-
54
-
55
-
56
-
57
-
58
-
59
-
60
-
61
-
62
-
63
-
64
-
65
-
66
-
67
-
68
-
69
-
70
-
71
-
72
-
73
-
74
-
75
-
76
-
77
-
78
-
79
-
80
-
81
-
82
-
83
-
 84
84 -
 85
85 -
 86
86 -
 87
87 -
 88
88 -
 89
89 -
 90
90 -
 91
91 -
 92
92 -
 93
93 -
 94
94 -
 95
95 -
 96
96 -
 97
97 -
 98
98 -
 99
99 -
 100
100 -
 101
101 -
 102
102 -
 103
103 -
 104
104 -
105
-
106
-
107
-
108
-
109
-
110
-
111
-
112
-
113
-
114
-
115
-
116
-
117
-
118
-
119
-
120
-
121
-
122
-
123
-
124
-
125
-
126
-
127
-
128
-
129
-
130
-
131
-
132
-
133
-
134
-
135
-
136
-
137
-
138
-
139
-
140
-
141
-
142
-
143
-
144
-
145
-
146
-
147
-
148
-
149
-
150
 |
 |
Table of Contents
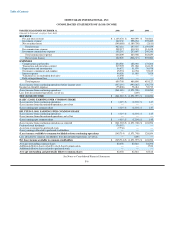
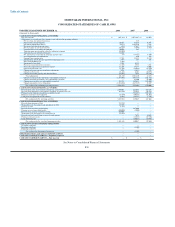
MONEYGRAM INTERNATIONAL, INC.
CONSOLIDATED STATEMENTS OF CASH FLOWS
FOR THE YEAR ENDED DECEMBER 31, 2008 2007 2006
(Amounts in thousands)
CASH FLOWS FROM OPERATING ACTIVITIES:
Net (loss) income $ (261,385) $ (1,071,997) $ 124,054
Adjustments to reconcile net (loss) income to net cash used in operating activities:
Net loss from discontinued operations — 249 —
Depreciation and amortization 56,672 51,979 38,978
Investment impairment charges 70,274 1,193,210 5,238
Provision for deferred income taxes (425) 37,637 33,155
Net loss (gain) on sale of investments 256,299 (3,649) (2,427)
Unrealized losses on trading investments 40,620 195 —
Valuation gain on put options related to trading investments (26,505) — —
Valuation loss on embedded derivative 16,030 — —
Net amortization of investment premiums and discounts 735 (15,752) (8,208)
Asset impairments and adjustments — 850 893
Signing bonus amortization 37,261 25,815 22,153
Amortization of debt discount and deferred financing costs 7,484 197 168
Debt extinguishment loss 1,499 — —
Impairment of goodwill 8,809 6,355 —
Provision for uncollectible receivables 12,396 8,532 3,931
Non-cash compensation and pension expense 12,596 14,177 6,600
Other non-cash items, net 11,709 (28,088) (25,870)
Change in foreign currency translation adjustments 3,039 (3,682) 3,795
Change in other assets (71,131) 5,401 (10,573)
Change in accounts payable and other liabilities (95,622) 7,984 (25,348)
Total adjustments 341,740 1,301,410 42,485
Change in cash and cash equivalents (substantially restricted) (2,524,402) (563,779) (261,725)
Change in trading investments, net (substantially restricted) — 83,200 22,200
Change in receivables, net (substantially restricted) 128,752 342,681 (335,509)
Change in payment service obligations (2,324,486) (447,319) 38,489
Net cash used in continuing operating activities (4,639,781) (355,804) (370,006)
CASH FLOWS FROM INVESTING ACTIVITIES:
Proceeds from sales of investments classified as available-for-sale 2,896,011 321,693 425,236
Proceeds from maturities of investments classified as available-for-sale 493,320 755,921 798,224
Purchases of investments classified as available-for-sale — (758,898) (707,452)
Purchases of property and equipment (38,470) (70,457) (81,033)
Cash paid for acquisitions and divestitures (2,928) (29,212) (7,311)
Net cash provided by investing activities 3,347,933 219,047 427,664
CASH FLOWS FROM FINANCING ACTIVITIES:
Proceeds from issuance of debt 733,750 — —
Transaction costs for issuance and amendment of debt (47,805) — —
Payment on debt (1,875) — —
Proceeds from revolving credit facility — 197,000 —
Payment on revolving credit facility (100,000) (2,000) —
Proceeds from issuance of preferred stock 760,000 — —
Transaction costs for issuance of preferred stock (52,222) — —
Proceeds and tax benefit from exercise of stock options — 7,674 24,643
Purchase of treasury stock — (45,992) (67,856)
Cash dividends paid — (16,625) (14,445)
Net cash provided by (used in) financing activities 1,291,848 140,057 (57,658)
CASH FLOWS OF DISCONTINUED OPERATIONS
Operating cash flows — — —
Investing cash flows — (3,300) —
Financing cash flows — — —
Net cash used in discontinued operations — (3,300) —
NET DECREASE IN CASH AND CASH EQUIVALENTS — — —
CASH AND CASH EQUIVALENTS — Beginning of period — — —
CASH AND CASH EQUIVALENTS — End of period $ — $ — $ —
See Notes to Consolidated Financial Statements
F-8