MoneyGram 2008 Annual Report Download - page 43
Download and view the complete annual report
Please find page 43 of the 2008 MoneyGram annual report below. You can navigate through the pages in the report by either clicking on the pages listed below, or by using the keyword search tool below to find specific information within the annual report.-
 1
1 -
2
-
3
-
4
-
5
-
6
-
7
-
8
-
9
-
10
-
11
-
12
-
13
-
14
-
15
-
16
-
17
-
18
-
19
-
20
-
21
-
22
-
23
-
24
-
25
-
26
-
27
-
28
-
29
-
30
-
31
-
32
-
 33
33 -
 34
34 -
 35
35 -
 36
36 -
 37
37 -
 38
38 -
 39
39 -
 40
40 -
 41
41 -
 42
42 -
 43
43 -
 44
44 -
 45
45 -
 46
46 -
 47
47 -
 48
48 -
 49
49 -
 50
50 -
 51
51 -
 52
52 -
 53
53 -
54
-
55
-
56
-
57
-
58
-
59
-
60
-
61
-
62
-
63
-
64
-
65
-
66
-
67
-
68
-
69
-
70
-
71
-
72
-
73
-
74
-
75
-
76
-
77
-
78
-
79
-
80
-
81
-
82
-
83
-
84
-
85
-
86
-
87
-
88
-
89
-
90
-
91
-
92
-
93
-
94
-
95
-
96
-
97
-
98
-
99
-
100
-
101
-
102
-
103
-
104
-
105
-
106
-
107
-
108
-
109
-
110
-
111
-
112
-
113
-
114
-
115
-
116
-
117
-
118
-
119
-
120
-
121
-
122
-
123
-
124
-
125
-
126
-
127
-
128
-
129
-
130
-
131
-
132
-
133
-
134
-
135
-
136
-
137
-
138
-
139
-
140
-
141
-
142
-
143
-
144
-
145
-
146
-
147
-
148
-
149
-
150
 |
 |

Table of Contents
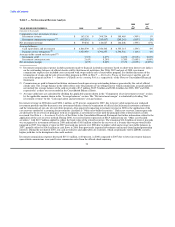
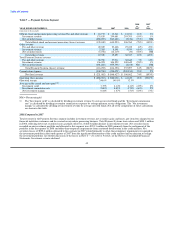
initiatives. Freight and supplies expense increased $2.1 million in connection with the growth in our agent locations and the roll-out of
several large agents in 2007. Office rent increased $1.9 million due to annual rent increases and expanded retail locations.
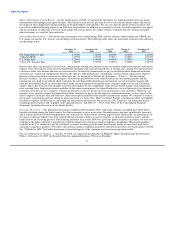
Interest expense — Interest expense increased by $84.0 million to $95.0 million in 2008 compared to 2007. This increase is primarily due
to higher outstanding debt resulting from the Capital Transaction, amortization of additional deferred financing costs from the new debt,
amortization of the debt discount on the Senior Facility and a $2.0 million net loss from the termination of interest rate swaps relating to
our floating rate debt in the second quarter of 2008. This increase was partially offset by the benefit of the declining interest rate
environment on our variable rate Senior Facility. See Note 7 — Derivative Financial Instruments of the Notes to Consolidated Financial
Statements for further information regarding the termination of swaps. See further discussion of the terms of our debt in Note 10 — Debt
of the Notes to Consolidated Financial Statements. Based on rates in effect at December 31, 2008 and the expectation that we will
continue to pay all interest in cash, we expect our interest expense to be approximately $99.2 million in 2009.
Interest expense increased 39 percent in 2007 compared to 2006, primarily due to higher average interest rates on our variable rate debt
and an increase in outstanding debt as we drew $195.0 million under our Senior Facility in the second half of 2007. The increase was
partially offset by net receipts of $1.5 million under our cash flow hedges.
Income taxes — For 2008, we had an effective income tax rate of 22.5 percent. The effective tax rate is 12.5 basis points lower than the
statutory tax rate primarily due to the $44.6 million net increase in the deferred tax asset valuation allowance, which includes a
$90.5 million benefit recognized in the fourth quarter of 2008. In the fourth quarter of 2008, we completed the evaluation of the technical
merits of tax positions with respect to part of the net securities losses from 2008 and 2007 and recorded a $90.5 million tax benefit from
the release of deferred tax valuation allowances. As we assess changes in facts in circumstances in the future, we may record additional
tax benefits as further deferred tax valuation allowances are released and carry- forwards are utilized. We continue to evaluate additional
available tax positions related to the net securities losses.
For 2007, we had an effective tax rate of negative 7.9 percent as compared to 29.8 percent in 2006. The decrease in the effective tax rate
in 2007 was due to establishing a deferred tax asset valuation allowance of $434.4 million relating primarily to investment losses in 2007.
Due to the amount and characterization of these losses, as of December 31, 2007, we determined that it was not "more likely than not"
that the deferred tax assets related to the losses would be realized.
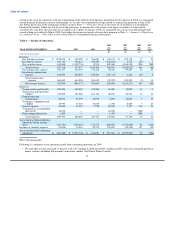
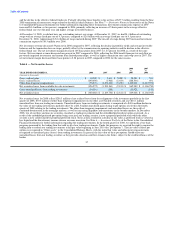
Segment Performance
We measure financial performance by our two business segments:
Global Funds Transfer — This segment provides global money transfer services. We also provide money orders and bill payment
services to consumers through the U.S. network of agents and, in select markets, company-operated locations. Fee revenue is driven by
transaction volume and fees per transaction. In addition, investment income is generated by investing funds received from the sale of
retail money orders until the instruments are settled.
Payment Systems — This segment provides financial institutions in the United States with payment processing services, primarily
official check outsourcing services, and money orders for sale to their customers. This segment also processes controlled
disbursements. Investment income is generated by investing funds received from the sale of payment instruments until the instruments
are settled. In addition, fee revenue is derived from per-item fees paid by our financial institution customers.
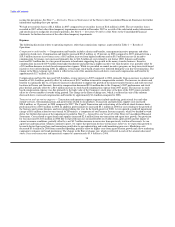
The business segments are determined based upon factors such as the type of customers, the nature of products and services provided and
the distribution channels used to provide those services. Segment pre-tax operating income and segment operating margin are used to
evaluate performance and allocate resources.
We manage our investment portfolio on a consolidated level, with no specific investment security assigned to a particular segment.
However, average investable balances are allocated to our segments based upon the average balances generated by that segment's sale of
payment instruments. Investment revenue and net securities gains
40