MoneyGram 2008 Annual Report Download - page 142
Download and view the complete annual report
Please find page 142 of the 2008 MoneyGram annual report below. You can navigate through the pages in the report by either clicking on the pages listed below, or by using the keyword search tool below to find specific information within the annual report.-
 1
1 -
2
-
3
-
4
-
5
-
6
-
7
-
8
-
9
-
10
-
11
-
12
-
13
-
14
-
15
-
16
-
17
-
18
-
19
-
20
-
21
-
22
-
23
-
24
-
25
-
26
-
27
-
28
-
29
-
30
-
31
-
32
-
33
-
34
-
35
-
36
-
37
-
38
-
39
-
40
-
41
-
42
-
43
-
44
-
45
-
46
-
47
-
48
-
49
-
50
-
51
-
52
-
53
-
54
-
55
-
56
-
57
-
58
-
59
-
60
-
61
-
62
-
63
-
64
-
65
-
66
-
67
-
68
-
69
-
70
-
71
-
72
-
73
-
74
-
75
-
76
-
77
-
78
-
79
-
80
-
81
-
82
-
83
-
84
-
85
-
86
-
87
-
88
-
89
-
90
-
91
-
92
-
93
-
94
-
95
-
96
-
97
-
98
-
99
-
100
-
101
-
102
-
103
-
104
-
105
-
106
-
107
-
108
-
109
-
110
-
111
-
112
-
113
-
114
-
115
-
116
-
117
-
118
-
119
-
120
-
121
-
122
-
123
-
124
-
125
-
126
-
127
-
128
-
129
-
130
-
131
-
 132
132 -
 133
133 -
 134
134 -
 135
135 -
 136
136 -
 137
137 -
 138
138 -
 139
139 -
 140
140 -
 141
141 -
 142
142 -
 143
143 -
 144
144 -
 145
145 -
 146
146 -
 147
147 -
 148
148 -
 149
149 -
 150
150
 |
 |

Table of Contents
MONEYGRAM INTERNATIONAL, INC. AND SUBSIDIARIES
NOTES TO CONSOLIDATED FINANCIAL STATEMENTS — (Continued)
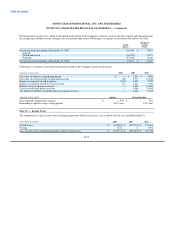
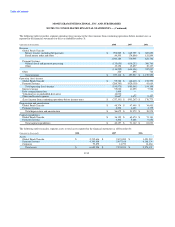
Geographic areas — International operations are located principally in Europe. International revenues are defined as revenues generated
from money transfer transactions originating in a country other than the United States. Long-lived assets are principally located in the
United States. The table below presents revenue by major geographic area for the year ended December 31:
(Amounts in thousands) 2008 2007 2006
United States $ 544,885 $ (142,766) $ 918,820
International 382,233 300,303 240,739
Total revenue $ 927,118 $ 157,537 $ 1,159,559
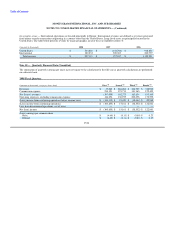
Note 18 — Quarterly Financial Data (Unaudited)
The summation of quarterly earnings per share may not equate to the calculation for the full year as quarterly calculations are performed
on a discrete basis.
2008 Fiscal Quarters
(Amounts in thousands, except per share data) First (1) Second (1) Third (1) Fourth (1)
Revenues $ 17,062 $ 286,088 $ 304,999 $ 318,969
Commission expense 214,121 123,713 141,365 125,409
Net (losses) revenues (197,059) 162,375 163,634 193,560
Operating expenses, excluding commission expense 146,056 138,955 202,098 172,592
(Loss) income from continuing operations before income taxes $ (343,115) $ 23,420 $ (38,464) $ 20,968
(Loss) income from continuing operations $ (360,855) $ 15,161 $ (38,552) $ 122,861
Loss from discontinued operations, net of taxes — — — —
Net (loss) income $ (360,855) $ 15,161 $ (38,552) $ 122,861
(Loss) earnings per common share
Basic $ (4.40) $ (0.11) $ (0.80) $ 0.23
Diluted $ (4.40) $ (0.11) $ (0.80) $ 0.47
F-56