MoneyGram 2008 Annual Report Download - page 112
Download and view the complete annual report
Please find page 112 of the 2008 MoneyGram annual report below. You can navigate through the pages in the report by either clicking on the pages listed below, or by using the keyword search tool below to find specific information within the annual report.-
 1
1 -
2
-
3
-
4
-
5
-
6
-
7
-
8
-
9
-
10
-
11
-
12
-
13
-
14
-
15
-
16
-
17
-
18
-
19
-
20
-
21
-
22
-
23
-
24
-
25
-
26
-
27
-
28
-
29
-
30
-
31
-
32
-
33
-
34
-
35
-
36
-
37
-
38
-
39
-
40
-
41
-
42
-
43
-
44
-
45
-
46
-
47
-
48
-
49
-
50
-
51
-
52
-
53
-
54
-
55
-
56
-
57
-
58
-
59
-
60
-
61
-
62
-
63
-
64
-
65
-
66
-
67
-
68
-
69
-
70
-
71
-
72
-
73
-
74
-
75
-
76
-
77
-
78
-
79
-
80
-
81
-
82
-
83
-
84
-
85
-
86
-
87
-
88
-
89
-
90
-
91
-
92
-
93
-
94
-
95
-
96
-
97
-
98
-
99
-
100
-
101
-
 102
102 -
 103
103 -
 104
104 -
 105
105 -
 106
106 -
 107
107 -
 108
108 -
 109
109 -
 110
110 -
 111
111 -
 112
112 -
 113
113 -
 114
114 -
 115
115 -
 116
116 -
 117
117 -
 118
118 -
 119
119 -
 120
120 -
 121
121 -
 122
122 -
123
-
124
-
125
-
126
-
127
-
128
-
129
-
130
-
131
-
132
-
133
-
134
-
135
-
136
-
137
-
138
-
139
-
140
-
141
-
142
-
143
-
144
-
145
-
146
-
147
-
148
-
149
-
150
 |
 |

Table of Contents
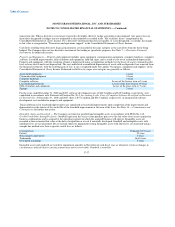
MONEYGRAM INTERNATIONAL, INC. AND SUBSIDIARIES
NOTES TO CONSOLIDATED FINANCIAL STATEMENTS — (Continued)
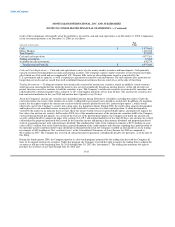
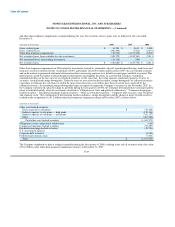
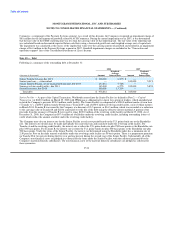
(Amounts in thousands) Level 1 Level 2 Level 3 Total
Cash equivalents (substantially restricted) $ 2,501,780 $ — $ — $ 2,501,780
Trading investments (substantially restricted) — — 21,485 21,485
Put options related to trading investments — — 26,505 26,505
Available-for-sale investments (substantially restricted) U.S. government agencies — 17,449 — 17,449
Residential mortgage-backed securities — agencies — 391,798 — 391,798
Other asset-backed securities — — 29,528 29,528
Total Financial Assets $ 2,501,780 $ 409,247 $ 77,518 $ 2,988,545
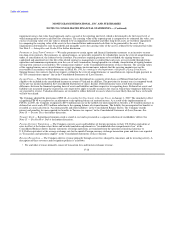
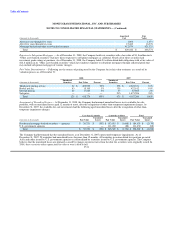
The tables below provide a roll-forward of the financial assets and liabilities classified in Level 3 which are measured at fair value on a
recurring basis.
Put Options Total
Related to Level 3
Trading Trading Available-for- Financial
(Amounts in thousands) Investments Investments Sale Investments Assets
Balance at January 1, 2008 $ 62,105 $ — $ 2,478,832 $ 2,540,937
Issuance of put options — 24,114 — 24,114
Sales and settlements — — (2,355,014) (2,355,014)
Realized losses — — (13,760) (13,760)
Principal paydowns — — (16,073) (16,073)
Other-than-temporary impairments — — (70,274) (70,274)
Unrealized gains — instruments still held at the reporting date — 2,391 5,817 8,208
Unrealized losses — instruments still held at the reporting date (40,620) — — (40,620)
Balance at December 31, 2008 $ 21,485 $ 26,505 $ 29,528 $ 77,518
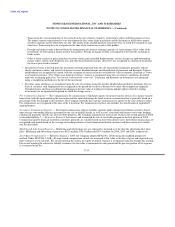
Total
Embedded Derivative Level 3
Derivatives in Financial Financial
(Amounts in thousands) Preferred Stock Instruments Liabilities
Balance at January 1, 2008 $ — $ 28,723 $ 28,723
Issuance of preferred stock 54,797 — 54,797
Valuation adjustment 16,030 973 17,003
Cash settlement of derivatives upon termination — (29,696) (29,696)
Reversal of liability to Additional paid-in capital (see Note 7) (70,827) — (70,827)
Balance at December 31, 2008 $ — $ — $ —
Note 6 — Investment Portfolio
The Company's portfolio is invested in cash and cash equivalents, trading investments and available-for-sale investments, all of which are
substantially restricted as described in Note 3 — Summary of Significant Accounting Policies. During the first quarter of 2008, the
Company realigned its investment portfolio away from asset-backed securities into highly liquid assets through the sale of a substantial
portion of its available-for-sale portfolio. As a F-26