MoneyGram 2008 Annual Report Download - page 37
Download and view the complete annual report
Please find page 37 of the 2008 MoneyGram annual report below. You can navigate through the pages in the report by either clicking on the pages listed below, or by using the keyword search tool below to find specific information within the annual report.-
 1
1 -
2
-
3
-
4
-
5
-
6
-
7
-
8
-
9
-
10
-
11
-
12
-
13
-
14
-
15
-
16
-
17
-
18
-
19
-
20
-
21
-
22
-
23
-
24
-
25
-
26
-
 27
27 -
 28
28 -
 29
29 -
 30
30 -
 31
31 -
 32
32 -
 33
33 -
 34
34 -
 35
35 -
 36
36 -
 37
37 -
 38
38 -
 39
39 -
 40
40 -
 41
41 -
 42
42 -
 43
43 -
 44
44 -
 45
45 -
 46
46 -
 47
47 -
48
-
49
-
50
-
51
-
52
-
53
-
54
-
55
-
56
-
57
-
58
-
59
-
60
-
61
-
62
-
63
-
64
-
65
-
66
-
67
-
68
-
69
-
70
-
71
-
72
-
73
-
74
-
75
-
76
-
77
-
78
-
79
-
80
-
81
-
82
-
83
-
84
-
85
-
86
-
87
-
88
-
89
-
90
-
91
-
92
-
93
-
94
-
95
-
96
-
97
-
98
-
99
-
100
-
101
-
102
-
103
-
104
-
105
-
106
-
107
-
108
-
109
-
110
-
111
-
112
-
113
-
114
-
115
-
116
-
117
-
118
-
119
-
120
-
121
-
122
-
123
-
124
-
125
-
126
-
127
-
128
-
129
-
130
-
131
-
132
-
133
-
134
-
135
-
136
-
137
-
138
-
139
-
140
-
141
-
142
-
143
-
144
-
145
-
146
-
147
-
148
-
149
-
150
 |
 |

Table of Contents
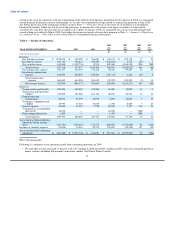
segment fee and other revenue grew 17 percent in 2008, driven by 18 percent growth in money transfer (including bill payment)
transaction revenue and a 15 percent growth in transaction volume.
• Investment revenue decreased $236.1 million, or 59 percent, in 2008 due to lower yields earned on our realigned investment
portfolio and a substantial decrease in our investment balances from the departure of official check financial institution customers.
• We recorded $340.7 million of net securities losses comprised of losses from the realignment of the portfolio in the first quarter of
2008, impairments on other asset-backed securities and mark-to-market losses on our trading investments, partially offset by
valuation gains from the receipt of put options relating to our trading investments. The Capital Transaction completed on March 25,
2008 included funds to cover these losses.
• Total commissions expense decreased $59.3 million, or 9 percent, due to lower investment balances from the departure of official
check financial institution customers, lower official check commission rates from repricing initiatives and declines in the effective
federal funds rate, partially offset by an increase in fee commissions from money transfer transaction growth and a $27.7 million net
loss upon the termination of interest rate swaps related to the official check business in the second quarter of 2008.
• Interest expense increased to $95.0 million in 2008 from $11.1 million in 2007 due to higher outstanding debt as a result of the
Capital Transaction and a $2.0 million net loss recorded upon the termination of interest rate swaps related to our floating rate debt
in the second quarter of 2008.
• Expenses increased $172.8 million, or 35 percent, in 2008 over 2007, primarily driven by: an $84.0 million increase in interest
expense; $17.7 million of severance and related costs for our former CEO; a $16.0 million non-cash valuation loss from embedded
derivatives in our Series B Stock; $9.5 million of costs related to the Capital Transaction and restructuring of the official check
business; an $8.8 million goodwill impairment charge resulting from our decision to exit the ACH Commerce business; an
$8.5 million increase in incentive compensation as we achieved a higher tier in our incentive plan; and variable costs related to
transaction volume, agent base and headcount growth.
• A significant amount of our internationally originated transactions and settlements with international agents are conducted in the
Euro. In addition, the operating expenses of most of our international subsidiaries are denominated in the Euro. The Euro was
stronger than the U.S. Dollar in 2008, with an average annual Euro to U.S. Dollar exchange rate of 1.47 versus 1.37 in 2007. The
strength of the Euro decreased our consolidated net loss by approximately $4.9 million for 2008.
• A tax benefit of $90.5 million related to net securities losses was recorded in the fourth quarter of 2008.
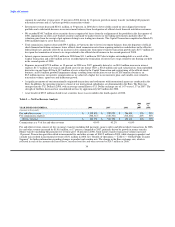
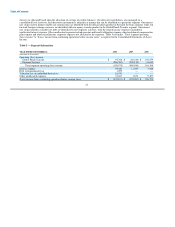
Table 2 — Net Fee Revenue Analysis
2008 2007
vs. vs.
YEAR ENDED DECEMBER 31, 2008 2007 2006 2007 2006
(Amounts in thousands)
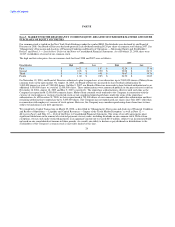
Fee and other revenue $ 1,105,676 $ 949,059 $ 766,881 17% 24%
Fee commissions expense (502,317) (410,301) (314,418) 22% 30%
Net fee revenue $ 603,359 $ 538,758 $ 452,463 12% 19%
Commissions as a % of fee and other revenue 45.4% 43.2% 41.0%
Fee and other revenue consists of fees on money transfer (including bill payment), money orders and official check transactions. In 2008,
fee and other revenue increased by $156.6 million, or 17 percent, compared to 2007, primarily driven by growth in money transfer.
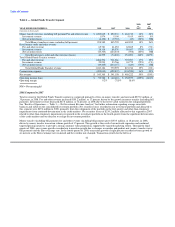
Money transfer (including bill payment) fee revenue grew 18 percent in 2008, while money transfer transaction volume increased
15 percent. Transaction growth resulted in incremental fee and other revenue of $149.2 million in 2008, while changes in product and
corridor mix resulted in incremental revenue of $3.1 million in 2008. See "Results of Operations — Table 6 — Global Funds Transfer
Segment" for further information regarding changes in product and corridor mix. The change in the Euro exchange rate, which is
reflected in each of the amounts discussed above, increased total fee and other revenue by $20.7 million in 2008.
34