MoneyGram 2008 Annual Report Download - page 92
Download and view the complete annual report
Please find page 92 of the 2008 MoneyGram annual report below. You can navigate through the pages in the report by either clicking on the pages listed below, or by using the keyword search tool below to find specific information within the annual report.-
 1
1 -
2
-
3
-
4
-
5
-
6
-
7
-
8
-
9
-
10
-
11
-
12
-
13
-
14
-
15
-
16
-
17
-
18
-
19
-
20
-
21
-
22
-
23
-
24
-
25
-
26
-
27
-
28
-
29
-
30
-
31
-
32
-
33
-
34
-
35
-
36
-
37
-
38
-
39
-
40
-
41
-
42
-
43
-
44
-
45
-
46
-
47
-
48
-
49
-
50
-
51
-
52
-
53
-
54
-
55
-
56
-
57
-
58
-
59
-
60
-
61
-
62
-
63
-
64
-
65
-
66
-
67
-
68
-
69
-
70
-
71
-
72
-
73
-
74
-
75
-
76
-
77
-
78
-
79
-
80
-
81
-
 82
82 -
 83
83 -
 84
84 -
 85
85 -
 86
86 -
 87
87 -
 88
88 -
 89
89 -
 90
90 -
 91
91 -
 92
92 -
 93
93 -
 94
94 -
 95
95 -
 96
96 -
 97
97 -
 98
98 -
 99
99 -
 100
100 -
 101
101 -
 102
102 -
103
-
104
-
105
-
106
-
107
-
108
-
109
-
110
-
111
-
112
-
113
-
114
-
115
-
116
-
117
-
118
-
119
-
120
-
121
-
122
-
123
-
124
-
125
-
126
-
127
-
128
-
129
-
130
-
131
-
132
-
133
-
134
-
135
-
136
-
137
-
138
-
139
-
140
-
141
-
142
-
143
-
144
-
145
-
146
-
147
-
148
-
149
-
150
 |
 |

Table of Contents
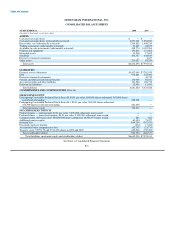
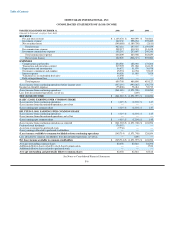
MONEYGRAM INTERNATIONAL, INC.
CONSOLIDATED STATEMENTS OF (LOSS) INCOME
FOR THE YEAR ENDED DECEMBER 31, 2008 2007 2006
(Amounts in thousands, except per share data)
REVENUE
Fee and other revenue $ 1,105,676 $ 949,059 $ 766,881
Investment revenue 162,130 398,234 395,489
Net securities losses (340,688) (1,189,756) (2,811)
Total revenue 927,118 157,537 1,159,559
Fee commissions expense 502,317 410,301 314,418
Investment commissions expense 102,292 253,607 249,241
Total commissions expense 604,609 663,908 563,659
Net revenue (losses) 322,509 (506,371) 595,900
EXPENSES
Compensation and benefits 224,580 188,092 172,264
Transaction and operations support 219,905 191,066 164,122
Depreciation and amortization 56,672 51,979 38,978
Occupancy, equipment and supplies 45,994 44,704 35,835
Interest expense 95,020 11,055 7,928
Valuation loss on embedded derivative 16,030 — —
Debt extinguishment loss 1,499 — —
Total expenses 659,700 486,896 419,127
(Loss) income from continuing operations before income taxes (337,191) (993,267) 176,773
Income tax (benefit) expense (75,806) 78,481 52,719
(Loss) income from continuing operations (261,385) (1,071,748) 124,054
Loss from discontinued operations, net of tax — (249) —
NET (LOSS) INCOME $ (261,385) $ (1,071,997) $ 124,054
BASIC (LOSS) EARNINGS PER COMMON SHARE
(Loss) income from continuing operations $ (4.19) $ (12.94) $ 1.47
(Loss) income from discontinued operations, net of tax — — —
(Loss) earnings per common share $ (4.19) $ (12.94) $ 1.47
DILUTED (LOSS) EARNINGS PER COMMON SHARE
(Loss) income from continuing operations $ (4.19) $ (12.94) $ 1.45
(Loss) income from discontinued operations, net of tax — — —
(Loss) earnings per common share $ (4.19) $ (12.94) $ 1.45
(Loss) income from continuing operations as reported $ (261,385) $ (1,071,748) $ 124,054
Preferred stock dividends (76,593) — —
Accretion recognized on preferred stock (7,736) — —
(Loss) earnings allocated to preferred stockholders — — —
(Loss) income available to common stockholders from continuing operations (345,714) (1,071,748) 124,054
Loss allocated to common stockholders from discontinued operations, net of tax — (249) —
Net (loss) income available to common stockholders $ (345,714) $ (1,071,997) $ 124,054
Average outstanding common shares 82,456 82,818 84,294
Additional dilutive shares related to stock-based compensation — — 1,524
Additional dilutive shares related to preferred stock — — —
Average outstanding and potentially dilutive common shares 82,456 82,818 85,818
See Notes to Consolidated Financial Statements
F-6