MoneyGram 2008 Annual Report Download - page 40
Download and view the complete annual report
Please find page 40 of the 2008 MoneyGram annual report below. You can navigate through the pages in the report by either clicking on the pages listed below, or by using the keyword search tool below to find specific information within the annual report.-
 1
1 -
2
-
3
-
4
-
5
-
6
-
7
-
8
-
9
-
10
-
11
-
12
-
13
-
14
-
15
-
16
-
17
-
18
-
19
-
20
-
21
-
22
-
23
-
24
-
25
-
26
-
27
-
28
-
29
-
 30
30 -
 31
31 -
 32
32 -
 33
33 -
 34
34 -
 35
35 -
 36
36 -
 37
37 -
 38
38 -
 39
39 -
 40
40 -
 41
41 -
 42
42 -
 43
43 -
 44
44 -
 45
45 -
 46
46 -
 47
47 -
 48
48 -
 49
49 -
 50
50 -
51
-
52
-
53
-
54
-
55
-
56
-
57
-
58
-
59
-
60
-
61
-
62
-
63
-
64
-
65
-
66
-
67
-
68
-
69
-
70
-
71
-
72
-
73
-
74
-
75
-
76
-
77
-
78
-
79
-
80
-
81
-
82
-
83
-
84
-
85
-
86
-
87
-
88
-
89
-
90
-
91
-
92
-
93
-
94
-
95
-
96
-
97
-
98
-
99
-
100
-
101
-
102
-
103
-
104
-
105
-
106
-
107
-
108
-
109
-
110
-
111
-
112
-
113
-
114
-
115
-
116
-
117
-
118
-
119
-
120
-
121
-
122
-
123
-
124
-
125
-
126
-
127
-
128
-
129
-
130
-
131
-
132
-
133
-
134
-
135
-
136
-
137
-
138
-
139
-
140
-
141
-
142
-
143
-
144
-
145
-
146
-
147
-
148
-
149
-
150
 |
 |

Table of Contents
and the decline in the effective federal funds rate. Partially offsetting these benefits is the net loss of $27.7 million resulting from the June
2008 termination of interest rate swaps related to the official check business. See Note 7 — Derivative Financial Instruments of the Notes
to Consolidated Financial Statements for further information regarding these terminations. Investment commissions expense in 2007
increased $4.4 million, or two percent, compared to 2006, primarily reflecting an increase of 5 basis points in the average effective
federal funds rate over the prior year and higher average investable balances.
At December 31, 2008, we did not have any outstanding interest rate swaps. At December 31, 2007, we had $1.4 billion of outstanding
swaps with an average fixed pay rate of 4.3 percent, compared to $2.6 billion with an average fixed pay rate of 4.3 percent at
December 31, 2006. Approximately $1.4 billion of swaps matured during 2007. The run-off of swaps during 2007 increased investment
commission expense by $4.5 million over 2006.
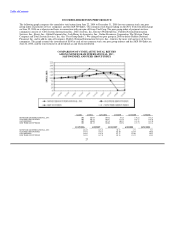
Net investment revenue decreased 59 percent in 2008 compared to 2007, reflecting the decline in portfolio yields and average investable
balances and the termination loss on swaps, partially offset by the commission rate repricing initiative and the decline in the effective
federal funds rate. The net investment margin decreased 105 basis points from 2007 to 1.23 percent for 2008 as a result of the same
factors. Net investment revenue decreased one percent in 2007 compared to 2006, reflecting the 2006 benefit from pre-tax cash flow on
previously impaired investments and income from limited partnerships, as well as higher commission rates and swap costs in 2007. The
net investment margin decreased three basis points to 2.28 percent in 2007 compared to 2006 for the same reasons.
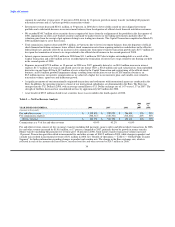
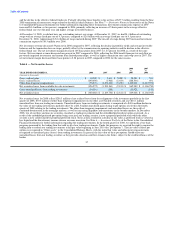
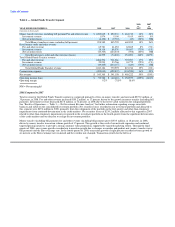
Table 4 — Net Securities Losses
2008 2007
vs. vs.
YEAR ENDED DECEMBER 31, 2008 2007 2006 2007 2006
(Amounts in thousands)
Gross realized gains $ 34,200 $ 5,611 $ 5,080 $ 28,589 $ 531
Gross realized losses (290,498) (1,962) (2,653) (288,536) 691
Other-than-temporary impairments (70,274) (1,193,210) (5,238) 1,122,936 (1,187,972)
Net securities losses from available-for-sale investments (326,572) (1,189,561) (2,811) $ 862,989 $ (1,186,750)
Gross unrealized losses from trading investments (14,116) (195) — (13,921) (195)
Net securities losses $ (340,688) $ (1,189,756) $ (2,811) $ 849,068 $ (1,186,945)
Net securities losses for 2008 reflect $256.3 million of net realized losses from the realignment of the investment portfolio in the first
quarter of 2008, $70.3 million of other-than-temporary impairments on our other asset-backed securities and a net $14.1 million
unrealized loss from our trading investments. Unrealized losses from our trading investments is comprised of a $40.6 million decline in
the value of our trading investments, partially offset by a $26.5 million unrealized gain relating to put options received in the fourth
quarter of 2008 relating to the trading investments. The other-than-temporary impairments and unrealized losses are the result of
continued deterioration in the mortgage markets, as well as increasing illiquidity and uncertainty in the broader markets. In December
2008, two of our three auction rate securities classified as trading investments had the embedded preferred put option exercised. As a
result of the embedded preferred put option being exercised, one trading security is now a perpetual preferred stock while the other
security is now collateralized by perpetual preferred stock. These actions resulted in a decline in fair value as preferred stock is viewed as
less liquid and the discretionary income streams are more uncertain. See Note 6 — Investment Portfolio of the Notes to the Consolidated
Financial Statements for further information regarding the trading investments. In the fourth quarter of 2008, we opted into a buy-back
program sponsored by the trading firm that sold us all of our trading investments. Under this program, we received the right to require the
trading firm to redeem our trading investments at full par value beginning in June 2010 (the "put options"). The fair value of these put
options is recognized in "Other assets" in the Consolidated Balance Sheets, with the initial fair value and subsequent remeasurements
recognized as unrealized gains (losses) from trading investments. In general, the fair value of these put options should offset any
unrealized losses from our trading securities as they provide a known cash flow stream in the future, subject to the creditworthiness of the
broker
37