MoneyGram 2008 Annual Report Download - page 38
Download and view the complete annual report
Please find page 38 of the 2008 MoneyGram annual report below. You can navigate through the pages in the report by either clicking on the pages listed below, or by using the keyword search tool below to find specific information within the annual report.-
 1
1 -
2
-
3
-
4
-
5
-
6
-
7
-
8
-
9
-
10
-
11
-
12
-
13
-
14
-
15
-
16
-
17
-
18
-
19
-
20
-
21
-
22
-
23
-
24
-
25
-
26
-
27
-
 28
28 -
 29
29 -
 30
30 -
 31
31 -
 32
32 -
 33
33 -
 34
34 -
 35
35 -
 36
36 -
 37
37 -
 38
38 -
 39
39 -
 40
40 -
 41
41 -
 42
42 -
 43
43 -
 44
44 -
 45
45 -
 46
46 -
 47
47 -
 48
48 -
49
-
50
-
51
-
52
-
53
-
54
-
55
-
56
-
57
-
58
-
59
-
60
-
61
-
62
-
63
-
64
-
65
-
66
-
67
-
68
-
69
-
70
-
71
-
72
-
73
-
74
-
75
-
76
-
77
-
78
-
79
-
80
-
81
-
82
-
83
-
84
-
85
-
86
-
87
-
88
-
89
-
90
-
91
-
92
-
93
-
94
-
95
-
96
-
97
-
98
-
99
-
100
-
101
-
102
-
103
-
104
-
105
-
106
-
107
-
108
-
109
-
110
-
111
-
112
-
113
-
114
-
115
-
116
-
117
-
118
-
119
-
120
-
121
-
122
-
123
-
124
-
125
-
126
-
127
-
128
-
129
-
130
-
131
-
132
-
133
-
134
-
135
-
136
-
137
-
138
-
139
-
140
-
141
-
142
-
143
-
144
-
145
-
146
-
147
-
148
-
149
-
150
 |
 |

Table of Contents
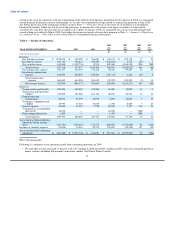
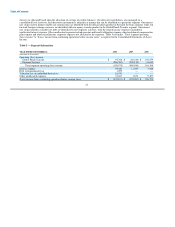
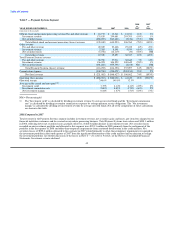
For 2007, fee and other revenue increased by $182.2 million, or 24 percent, compared to 2006, primarily driven by growth in money
transfer (including bill payment). Growth in money transfer fee and other revenue (including bill payment) continued to be in line with
growth in money transfer transaction volume, which increased 27 percent during the year as a result of our network expansion and
targeted pricing initiatives. Transaction growth resulted in incremental fee and other revenue of $179.0 million. This transaction growth
was offset slightly by a $9.9 million decrease in money transfer fees resulting from targeted pricing initiatives and changes in geographic
and product mix (money transfer versus bill payment). The change in the Euro exchange rate increased total fee and other revenue by
$21.5 million in 2007 compared to 2006.
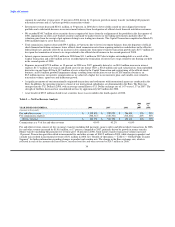
Our targeted pricing initiatives, which were initiated in the first half of 2005, included reducing the number of pricing tiers or bands,
allowing us to manage our price-volume dynamic while streamlining the point of sale process for our agents and customers. While
simplified pricing initiatives have contributed to a lower average per transaction fee, we believe that the initiatives have contributed to
our volume growth for money transfer as simpler pricing and lower overall fees attract new customers. During 2007, the gap between
total revenue growth and money transfer transaction growth narrowed primarily because we lapped the first full year of implementation
of simplified pricing initiatives.
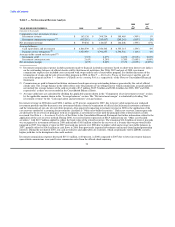
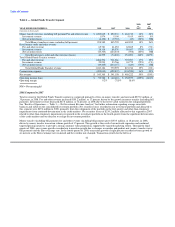
Fee commissions consist primarily of fees paid to our third-party agents for the money transfer service as we generally do not pay fee
commissions on our money order products. In 2008, fee commissions expense increased $92.0 million, or 22 percent, compared to 2007.
Higher money transfer transaction volumes increased fee commissions expense by $59.7 million while higher average commissions per
transaction, primarily from higher commissions paid to Walmart Stores, Inc. ("Walmart") from new contract pricing, increased
commissions by $16.4 million. Amortization of signing bonuses increased $11.4 million in 2008 from the signing of several large agents
in 2007 and one large agent in the first quarter of 2008. The change in the Euro exchange rate, which is reflected in each of the amounts
discussed above, increased fee commissions expense by $10.2 million.
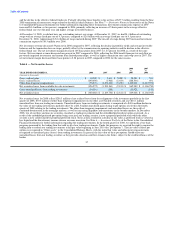
For 2007, fee commissions expense grew at a faster pace than fee revenue, increasing $95.9 million, or 30 percent, compared to 2006,
driven by higher money transfer transaction volume, tiered commissions and a stronger Euro. Higher money transfer transaction volumes
increased fee commissions expense by $79.0 million, while higher average commissions per transaction increased commissions by
$10.2 million, primarily from tiered commissions. Tiered commissions are commission rates that are adjusted upward, subject to certain
caps, as an agent's transaction volume grows. We use tiered commission rates as an incentive for select agents to grow transaction volume
by paying our agents for performance and allowing them to participate in adding market share for MoneyGram. The change in the Euro
exchange rate, which is reflected in each of the amounts above, increased fee commissions by $9.7 million in 2007 compared to 2006.
Net fee revenue increased 12 percent in 2008, compared to 2007. Net fee revenue growth is lower than fee and other revenue growth as
fee commissions expense increased at a faster pace than revenue, primarily from higher commission rates and amortization of signing
bonuses. Net fee revenue increased 19 percent in 2007, compared to 2006, driven primarily by the increase in money transfer transaction
volume. Growth in net fee revenue in 2007, compared to 2006, was lower than fee and other revenue growth primarily due to tiered
commissions.
35