MoneyGram 2008 Annual Report Download - page 47
Download and view the complete annual report
Please find page 47 of the 2008 MoneyGram annual report below. You can navigate through the pages in the report by either clicking on the pages listed below, or by using the keyword search tool below to find specific information within the annual report.-
 1
1 -
2
-
3
-
4
-
5
-
6
-
7
-
8
-
9
-
10
-
11
-
12
-
13
-
14
-
15
-
16
-
17
-
18
-
19
-
20
-
21
-
22
-
23
-
24
-
25
-
26
-
27
-
28
-
29
-
30
-
31
-
32
-
33
-
34
-
35
-
36
-
 37
37 -
 38
38 -
 39
39 -
 40
40 -
 41
41 -
 42
42 -
 43
43 -
 44
44 -
 45
45 -
 46
46 -
 47
47 -
 48
48 -
 49
49 -
 50
50 -
 51
51 -
 52
52 -
 53
53 -
 54
54 -
 55
55 -
 56
56 -
 57
57 -
58
-
59
-
60
-
61
-
62
-
63
-
64
-
65
-
66
-
67
-
68
-
69
-
70
-
71
-
72
-
73
-
74
-
75
-
76
-
77
-
78
-
79
-
80
-
81
-
82
-
83
-
84
-
85
-
86
-
87
-
88
-
89
-
90
-
91
-
92
-
93
-
94
-
95
-
96
-
97
-
98
-
99
-
100
-
101
-
102
-
103
-
104
-
105
-
106
-
107
-
108
-
109
-
110
-
111
-
112
-
113
-
114
-
115
-
116
-
117
-
118
-
119
-
120
-
121
-
122
-
123
-
124
-
125
-
126
-
127
-
128
-
129
-
130
-
131
-
132
-
133
-
134
-
135
-
136
-
137
-
138
-
139
-
140
-
141
-
142
-
143
-
144
-
145
-
146
-
147
-
148
-
149
-
150
 |
 |

Table of Contents
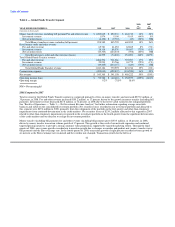
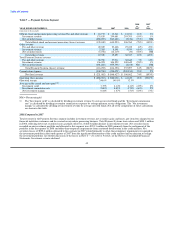
2007 Compared to 2006
Total revenue for the Global Funds Transfer segment decreased $50.8 million, or six percent, in 2007, due to net securities losses of
$234.2 million from other-than-temporary impairments that were recorded in our investment portfolio and allocated to this segment,
significantly offset by strong fee and other revenue growth. See further discussion of the net securities losses in Note 6 — Investment
Portfolio of the Notes to Consolidated Financial Statements. Fee and other revenue increased $183.8 million, or 25 percent, in 2007,
driven by the growth in the money transfer business (including bill payment). Money transfer fee and other revenue increased 28 percent,
while money transfer transaction volume grew 27 percent as a result of our network expansion and targeted pricing initiatives.
Transaction growth resulted in incremental fee and other revenue of $179.0 million. Changes in geographic mix and product mix (money
transfer versus bill payment) and targeted pricing initiatives resulted in a $9.9 million decline in fee and other revenue. Our domestic
transactions, which contribute lower revenue per transaction, grew at a rate of 38 percent in 2007, while internationally originated
transactions (outside of North America) grew 34 percent. Growth in transaction volume to Mexico was eight percent in 2007 compared to
29 percent in 2006, reflecting the economic conditions in the U.S. housing market and immigration concerns. Our Mexico volume
represented 10 percent of our total transactions in 2007, compared to 11 percent in 2006. The money transfer agent base expanded
30 percent in 2007, primarily in the international markets, to about 143,000 locations.
Fee and other revenue for retail money order decreased three percent in 2007 compared to 2006, in-line with the decline in volume.
Investment revenue decreased one percent in 2007 due to lower average investable balances and as 2006 benefited from $3.1 million of
pre-tax cash flow on previously impaired investments and income from limited partnership interests. Pre-tax cash flows in 2007 from
previously impaired investments and income from limited partnership interests was nominal. Partially offsetting these factors was a
benefit from higher yields earned on our cash investments and adjustable rate securities due to the disruption in the credit markets in the
second half of 2007. See "Results of Operations — Table 3 — Net Investment Revenue Analysis" for further information regarding
average investable balances and yields on the consolidated investment portfolio.
Commissions expense increased 29 percent in 2007, primarily driven by tiered commission rates paid to certain agents and increases in
the Euro exchange rate. Tiered commissions are commission rates that are adjusted upward, subject to certain caps, as an agent's
transaction volume grows. We use tiered commission rates as an incentive for select agents to grow transaction volume by paying the
agents for performance and allowing the agent to participate in adding market share for MoneyGram. Walmart achieved new tiers in the
third quarter of 2006 and the fourth quarter of 2007.
Operating loss of $60.4 million in 2007 decreased from operating income of $152.6 million in 2006, reflecting the net securities losses of
$234.2 million in 2007, partially offset by the growth in money transfer (including bill payment). The operating margin of (7.8) percent in
2007 declined from 18.6 percent in 2006, reflecting the net securities losses in 2007 and the growth of money transfer commissions
expense at a faster rate than money transfer fee revenue due to tiered pricing.
44