MoneyGram 2008 Annual Report Download - page 48
Download and view the complete annual report
Please find page 48 of the 2008 MoneyGram annual report below. You can navigate through the pages in the report by either clicking on the pages listed below, or by using the keyword search tool below to find specific information within the annual report.-
 1
1 -
2
-
3
-
4
-
5
-
6
-
7
-
8
-
9
-
10
-
11
-
12
-
13
-
14
-
15
-
16
-
17
-
18
-
19
-
20
-
21
-
22
-
23
-
24
-
25
-
26
-
27
-
28
-
29
-
30
-
31
-
32
-
33
-
34
-
35
-
36
-
37
-
 38
38 -
 39
39 -
 40
40 -
 41
41 -
 42
42 -
 43
43 -
 44
44 -
 45
45 -
 46
46 -
 47
47 -
 48
48 -
 49
49 -
 50
50 -
 51
51 -
 52
52 -
 53
53 -
 54
54 -
 55
55 -
 56
56 -
 57
57 -
 58
58 -
59
-
60
-
61
-
62
-
63
-
64
-
65
-
66
-
67
-
68
-
69
-
70
-
71
-
72
-
73
-
74
-
75
-
76
-
77
-
78
-
79
-
80
-
81
-
82
-
83
-
84
-
85
-
86
-
87
-
88
-
89
-
90
-
91
-
92
-
93
-
94
-
95
-
96
-
97
-
98
-
99
-
100
-
101
-
102
-
103
-
104
-
105
-
106
-
107
-
108
-
109
-
110
-
111
-
112
-
113
-
114
-
115
-
116
-
117
-
118
-
119
-
120
-
121
-
122
-
123
-
124
-
125
-
126
-
127
-
128
-
129
-
130
-
131
-
132
-
133
-
134
-
135
-
136
-
137
-
138
-
139
-
140
-
141
-
142
-
143
-
144
-
145
-
146
-
147
-
148
-
149
-
150
 |
 |

Table of Contents
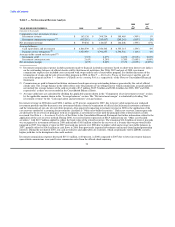
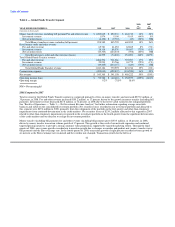
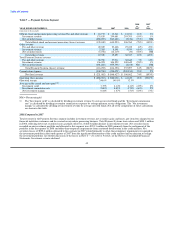
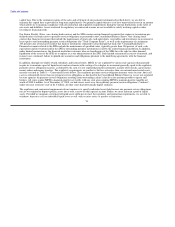
Table 7 — Payment Systems Segment
2008 2007
vs. vs.
YEAR ENDED DECEMBER 31, 2008 2007 2006 2007 2006
(Amounts in thousands)
Official check and payment processing revenue Fee and other revenue $ 16,737 $ 13,546 $ 13,211 24% 3%
Investment revenue 133,820 299,681 295,703 (55%) 1%
Net securities losses (286,207) (943,480) (2,154) (70%) NM
Total official check and payment processing (losses) revenue (135,650) (630,253) 306,760 (78%) (305%)
Other revenue
Fee and other revenue 22,049 23,468 25,432 (6%) (8%)
Investment revenue 2,385 4,548 4,939 (48%) (8%)
Net securities losses (5,076) (12,119) (34) (58%) NM
Total other revenue 19,358 15,897 30,337 22% (48%)
Total Payment Systems revenue
Fee and other revenue 38,786 37,014 38,643 5% (4%)
Investment revenue 136,205 304,229 300,642 (55%) 1%
Net securities losses (291,283) (955,599) (2,188) NM NM
Total Payment Systems (losses) revenue (116,292) (614,356) 337,097 81% (282%)
Commissions expense (104,790) (234,071) (230,135) 55% 2%
Net (loss) revenue $ (221,082) $ (848,427) $ 106,962 74% (893%)
Operating (loss) income $ (286,763) $ (920,130) $ 41,619 69% (2311%)
Operating margin 246.6% 149.8% 12.3%
Average yields earned and rates paid (1):
Investment yield 3.37% 6.14% 6.11% (45%) 0%
Investment commission rate 2.60% 4.82% 4.72% (46%) 2%
Net investment margin 0.84% 1.47% 1.51% (43%) (3%)
NM = Not meaningful
(1) The "Investment yield" is calculated by dividing investment revenue by average invested funds and the "Investment commission
rate" is calculated by dividing investment commissions expense by average payment service obligations. The "Net investment
margin" is calculated by dividing net investment revenue by average invested funds. Not all of the components of these calculations
are shown in this table.
2008 Compared to 2007
Total revenue for the Payment Systems segment includes investment revenue, net securities gains and losses, per-item fees charged to our
financial institution customers and fees earned on our rebate processing business. Total Payment Systems losses decreased $498.1 million
in 2008, reflecting lower net securities losses, partially offset by a $168.0 million decline in investment revenue. Net securities losses
recorded on our investment portfolio and allocated to this segment were $291.3 million in 2008, primarily from the realignment of the
portfolio in the first quarter of 2008 and other-than-temporary impairments from continued deterioration in the credit markets. Net
securities losses of $955.6 million allocated to this segment in 2007 related primarily to other-than-temporary impairments recognized in
the investment portfolio in the fourth quarter of 2007 from the significant deterioration of the credit markets and our decision to realign
the investment portfolio. See further discussion of the losses in Note 6 — Investment Portfolio of the Notes to Consolidated Financial
Statements. Investment revenue declined
45