MoneyGram 2008 Annual Report Download - page 60
Download and view the complete annual report
Please find page 60 of the 2008 MoneyGram annual report below. You can navigate through the pages in the report by either clicking on the pages listed below, or by using the keyword search tool below to find specific information within the annual report.-
 1
1 -
2
-
3
-
4
-
5
-
6
-
7
-
8
-
9
-
10
-
11
-
12
-
13
-
14
-
15
-
16
-
17
-
18
-
19
-
20
-
21
-
22
-
23
-
24
-
25
-
26
-
27
-
28
-
29
-
30
-
31
-
32
-
33
-
34
-
35
-
36
-
37
-
38
-
39
-
40
-
41
-
42
-
43
-
44
-
45
-
46
-
47
-
48
-
49
-
 50
50 -
 51
51 -
 52
52 -
 53
53 -
 54
54 -
 55
55 -
 56
56 -
 57
57 -
 58
58 -
 59
59 -
 60
60 -
 61
61 -
 62
62 -
 63
63 -
 64
64 -
 65
65 -
 66
66 -
 67
67 -
 68
68 -
 69
69 -
 70
70 -
71
-
72
-
73
-
74
-
75
-
76
-
77
-
78
-
79
-
80
-
81
-
82
-
83
-
84
-
85
-
86
-
87
-
88
-
89
-
90
-
91
-
92
-
93
-
94
-
95
-
96
-
97
-
98
-
99
-
100
-
101
-
102
-
103
-
104
-
105
-
106
-
107
-
108
-
109
-
110
-
111
-
112
-
113
-
114
-
115
-
116
-
117
-
118
-
119
-
120
-
121
-
122
-
123
-
124
-
125
-
126
-
127
-
128
-
129
-
130
-
131
-
132
-
133
-
134
-
135
-
136
-
137
-
138
-
139
-
140
-
141
-
142
-
143
-
144
-
145
-
146
-
147
-
148
-
149
-
150
 |
 |

Table of Contents
Transaction to invest in cash equivalents and settle payment service obligations for instruments sold by departing official check financial
institution customers in connection with the official check restructuring.
Operating activities in 2007 used net cash of $355.8 million. Our payment service assets and obligations used $585.2 million of cash due
to the normal fluctuations in the timing of settlements of outstanding payment service instruments and the receipt of collected funds from
our agents, partially offset by proceeds from the sale of a trading investment for $83.2 million. Besides normal operating activities, cash
provided by continuing operations was used to pay $33.1 million for signing bonuses to new agents, $16.0 million of income taxes and
$11.6 million of interest on our debt.
Operating activities in 2006 used net cash of $370.0 million. Our payment service assets and obligations used $536.5 million of cash due
to the normal fluctuations in the timing of settlements of outstanding payment service instruments and the receipt of collected funds from
our agents, partially offset by proceeds from the sale of a trading investment for $22.2 million. Besides normal operating activities, cash
provided by continuing operations was used to pay $26.9 million for signing bonuses to new agents, $38.7 million of income taxes and
$8.5 million of interest on our debt.
To understand the cash flow activity of our business, the cash provided by (used in) operating activities relating to the payment service
assets and obligations should be reviewed in conjunction with the cash provided by (used in) investing activities related to our investment
portfolio.
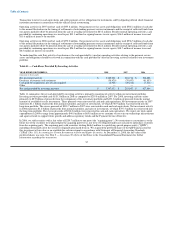
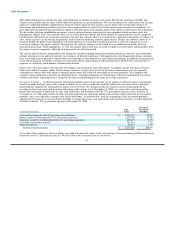
Table 11 — Cash Flows Provided By Investing Activities
YEAR ENDED DECEMBER 31, 2008 2007 2006
(Amounts in thousands)
Net investment activity $ 3,389,331 $ 318,716 $ 516,008
Purchases of property and equipment (38,470) (70,457) (81,033)
Cash paid for acquisitions, net of cash acquired (2,928) (29,212) (7,311)
Other — — —
Net cash provided by investing activities $ 3,347,933 $ 219,047 $ 427,664
Table 11 summarizes the net cash provided by investing activities, primarily consisting of activity within our investment portfolio.
Investing activities provided cash of $3.3 billion in 2008 as compared to $219.0 million in 2007. For 2008, investing activities relate
primarily to $2.9 billion of proceeds from the realignment of the investment portfolio and $493.3 million of proceeds from the normal
maturity of available-for-sale investments. These proceeds were reinvested in cash and cash equivalents. Net investment activity in 2007
represents $1.1 billion of proceeds from normal maturities and sales of investments, of which $758.9 million was reinvested into the
long-term portfolio. The excess proceeds of $318.7 million in 2007 were reinvested in cash and cash equivalents. Net investment activity
in 2006 represents $1.2 billion of proceeds from normal maturities and sales of investments, of which $707.5 million was reinvested into
the long-term portfolio. The excess proceeds of $516.0 million were reinvested in cash and cash equivalents. We expect our total capital
expenditures in 2009 to range from approximately $40.0 million to $65.0 million as we continue to invest in our technology infrastructure
and agent network to support future growth and address regulatory trends and the Payment Services Directive.
In 2006, we sold securities with a fair value of $259.7 million to one party (the "acquiring party"). No restrictions or constraints as to the
future use of the securities were placed upon the acquiring party by us, nor were we obligated under any scenario to repurchase securities
from the acquiring party. The acquiring party sold securities totaling $646.8 million to a qualifying special purpose entity ("QSPE"),
including substantially all of the securities originally purchased from us. We acquired the preferred shares of the QSPE and account for
this investment at fair value as an available-for-sale investment in accordance with Statement of Financial Accounting Standards
("SFAS") No. 115, Accounting for Certain Investments in Debt and Equity Securities. At December 31, 2008, the fair value of the
preferred shares was zero. See Note 5 — Investment Portfolio of the Notes to the Consolidated Financial Statements for further
information regarding this transaction.
57