MoneyGram 2008 Annual Report Download - page 39
Download and view the complete annual report
Please find page 39 of the 2008 MoneyGram annual report below. You can navigate through the pages in the report by either clicking on the pages listed below, or by using the keyword search tool below to find specific information within the annual report.-
 1
1 -
2
-
3
-
4
-
5
-
6
-
7
-
8
-
9
-
10
-
11
-
12
-
13
-
14
-
15
-
16
-
17
-
18
-
19
-
20
-
21
-
22
-
23
-
24
-
25
-
26
-
27
-
28
-
 29
29 -
 30
30 -
 31
31 -
 32
32 -
 33
33 -
 34
34 -
 35
35 -
 36
36 -
 37
37 -
 38
38 -
 39
39 -
 40
40 -
 41
41 -
 42
42 -
 43
43 -
 44
44 -
 45
45 -
 46
46 -
 47
47 -
 48
48 -
 49
49 -
50
-
51
-
52
-
53
-
54
-
55
-
56
-
57
-
58
-
59
-
60
-
61
-
62
-
63
-
64
-
65
-
66
-
67
-
68
-
69
-
70
-
71
-
72
-
73
-
74
-
75
-
76
-
77
-
78
-
79
-
80
-
81
-
82
-
83
-
84
-
85
-
86
-
87
-
88
-
89
-
90
-
91
-
92
-
93
-
94
-
95
-
96
-
97
-
98
-
99
-
100
-
101
-
102
-
103
-
104
-
105
-
106
-
107
-
108
-
109
-
110
-
111
-
112
-
113
-
114
-
115
-
116
-
117
-
118
-
119
-
120
-
121
-
122
-
123
-
124
-
125
-
126
-
127
-
128
-
129
-
130
-
131
-
132
-
133
-
134
-
135
-
136
-
137
-
138
-
139
-
140
-
141
-
142
-
143
-
144
-
145
-
146
-
147
-
148
-
149
-
150
 |
 |
Table of Contents
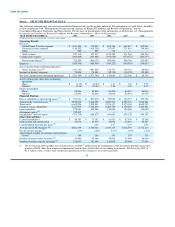
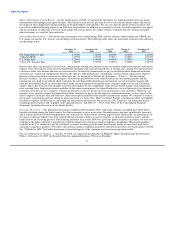
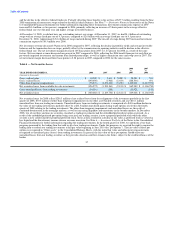
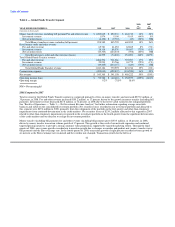
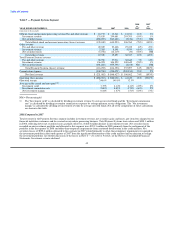
Table 3 — Net Investment Revenue Analysis
2008 2007
vs. vs.
YEAR ENDED DECEMBER 31, 2008 2007 2006 2007 2006
(Amounts in thousands)
Components of net investment revenue:
Investment revenue $ 162,130 $ 398,234 $ 395,489 (59%) 1%
Investment commissions expense (1) (102,292) (253,607) (249,241) (60%) 2%
Net investment revenue $ 59,838 $ 144,627 $ 146,248 (59%) (1%)
Average balances:
Cash equivalents and investments $ 4,866,339 $ 6,346,442 $ 6,333,115 (23%) 0%
Payment service obligations (2) 3,923,989 4,796,257 4,796,538 (18%) 0%
Average yields earned and rates paid (3):
Investment yield 3.33% 6.27% 6.24% (2.94%) 0.03%
Investment commission rate 2.61% 5.29% 5.20% (2.68%) 0.09%
Net investment margin 1.23% 2.28% 2.31% (1.05%) (0.03%)
(1) Investment commissions expense includes payments made to financial institution customers based on short-term interest rate indices
on the outstanding balances of official checks sold by that financial institution. For 2006, 2007 and part of 2008, investment
commissions expense also included costs associated with swaps and the sale of receivables program. See further discussion of the
termination of swaps and the sale of receivables program in 2008, in Note 7 — Derivative Financial Instruments and the sales of
receivables program in Note 3 — Summary of Significant Accounting Policies, respectively, of the Notes to Consolidated Financial
Statements.
(2) Commissions are paid to financial institution customers based upon average outstanding balances generated by the sale of official
checks only. The average balance in the table reflects only the payment service obligations for which commissions are paid and does
not include the average balance of the sold receivables ($3.7 million, $349.9 million and $382.6 million for 2008, 2007 and 2006,
respectively) as these are not recorded in the Consolidated Balance Sheets.
(3) Average yields/rates are calculated by dividing the applicable amount shown in the "Components of net investment revenue" section
by the applicable amount shown in the "Average balances" section. The "Net investment margin" is calculated by dividing "Net
investment revenue" by the "Cash equivalents and investments" average balance.
Investment revenue in 2008 decreased $236.1 million, or 59 percent, compared to 2007, due to lower yields earned on our realigned
investment portfolio and the decrease in our investment balances from the termination of official check financial institution customers
and the termination of our sale of receivables program. Also negatively impacting investment revenue in 2008 is the application of the
cost recovery method of accounting for investments classified as "Other asset-backed securities." Under cost recovery, interest proceeds
are deemed to be recoveries of principal, with no recognition as investment revenue until the principal of the related security is fully
recovered. See Note 6 — Investment Portfolio of the Notes to the Consolidated Financial Statements for further information related to the
application of the cost recovery method. During 2008, we received interest proceeds of $26.9 million from our "Other asset-backed
securities," with $10.7 million applied to reduce the book value of the related securities. The remaining $16.2 million of interest proceeds
was recognized as investment revenue in 2008 and includes $10.0 million related to the recovery of a security that was previously fully
impaired in 2007. Investment revenue in 2007 increased one percent over 2006 due to higher yields and average investable balances in
2007, partially offset by $14.0 million in cash flows in 2006 from previously impaired investments and income from limited partnership
interests. During the last half of 2007, our cash investments and adjustable rate securities, which are primarily tied to LIBOR, earned a
higher yield due to the disruption in the credit markets.
Investment commissions expense decreased $151.3 million, or 60 percent, in 2008 compared to 2007 due to lower investment balances
upon which commissions were paid, lower commission rates from the official check repricing
36