MoneyGram 2008 Annual Report Download - page 134
Download and view the complete annual report
Please find page 134 of the 2008 MoneyGram annual report below. You can navigate through the pages in the report by either clicking on the pages listed below, or by using the keyword search tool below to find specific information within the annual report.-
 1
1 -
2
-
3
-
4
-
5
-
6
-
7
-
8
-
9
-
10
-
11
-
12
-
13
-
14
-
15
-
16
-
17
-
18
-
19
-
20
-
21
-
22
-
23
-
24
-
25
-
26
-
27
-
28
-
29
-
30
-
31
-
32
-
33
-
34
-
35
-
36
-
37
-
38
-
39
-
40
-
41
-
42
-
43
-
44
-
45
-
46
-
47
-
48
-
49
-
50
-
51
-
52
-
53
-
54
-
55
-
56
-
57
-
58
-
59
-
60
-
61
-
62
-
63
-
64
-
65
-
66
-
67
-
68
-
69
-
70
-
71
-
72
-
73
-
74
-
75
-
76
-
77
-
78
-
79
-
80
-
81
-
82
-
83
-
84
-
85
-
86
-
87
-
88
-
89
-
90
-
91
-
92
-
93
-
94
-
95
-
96
-
97
-
98
-
99
-
100
-
101
-
102
-
103
-
104
-
105
-
106
-
107
-
108
-
109
-
110
-
111
-
112
-
113
-
114
-
115
-
116
-
117
-
118
-
119
-
120
-
121
-
122
-
123
-
 124
124 -
 125
125 -
 126
126 -
 127
127 -
 128
128 -
 129
129 -
 130
130 -
 131
131 -
 132
132 -
 133
133 -
 134
134 -
 135
135 -
 136
136 -
 137
137 -
 138
138 -
 139
139 -
 140
140 -
 141
141 -
 142
142 -
 143
143 -
 144
144 -
145
-
146
-
147
-
148
-
149
-
150
 |
 |

Table of Contents
MONEYGRAM INTERNATIONAL, INC. AND SUBSIDIARIES
NOTES TO CONSOLIDATED FINANCIAL STATEMENTS — (Continued)
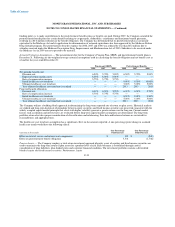
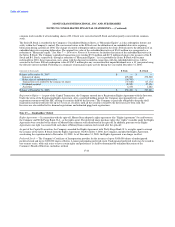
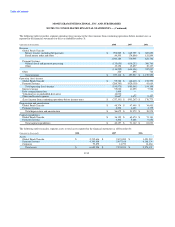
Restricted stock awards were valued at the quoted market price of the Company's common stock on the date of grant and expensed using
the straight-line method over the vesting or service period of the award. Following is a summary of restricted stock activity for 2008:
Weighted
Total Average
Shares Price
Restricted stock outstanding at December 31, 2007 234,354 $ 26.84
Granted — —
Vested and issued (55,233) 21.73
Forfeited (87,450) 28.60
Restricted stock outstanding at December 31, 2008 91,671 $ 28.25
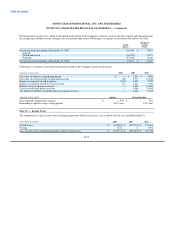
Following is a summary of pertinent information related to the Company's stock-based awards:
(Amounts in thousands) 2008 2007 2006
Fair value of options vesting during period $ — $ 2,591 $ 5,680
Fair value of restricted stock vesting during period 458 5,337 13,245
Expense recognized related to options 3,274 3,852 2,725
Expense recognized related to restricted stock 417 2,247 1,950
Intrinsic value of options exercised — 3,582 15,490
Cash received from option exercises — 6,606 21,899
Tax benefit realized for tax deductions from option exercises — 1,068 2,744
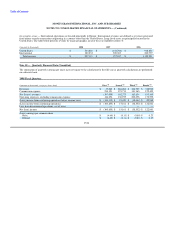
(Amounts in thousands) Options Restricted Stock
Unrecognized compensation expense $ 1,979 $ 424
Remaining weighted average vesting period 0.69 years 1.23 years
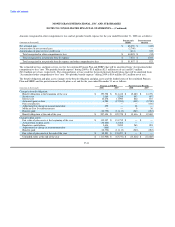
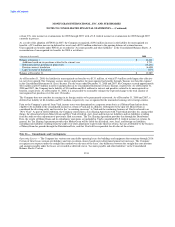
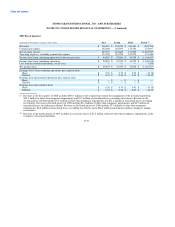
Note 15 — Income Taxes
The components of (loss) income from continuing operations before income taxes are as follows for the year ended December 31:
(Amounts in thousands) 2008 2007 2006
United States $ (345,063) $ (993,273) $ 171,681
Foreign 7,872 6 5,092
(Loss) income from continuing operations before income taxes $ (337,191) $ (993,267) $ 176,773
F-48