MoneyGram 2008 Annual Report Download - page 45
Download and view the complete annual report
Please find page 45 of the 2008 MoneyGram annual report below. You can navigate through the pages in the report by either clicking on the pages listed below, or by using the keyword search tool below to find specific information within the annual report.-
 1
1 -
2
-
3
-
4
-
5
-
6
-
7
-
8
-
9
-
10
-
11
-
12
-
13
-
14
-
15
-
16
-
17
-
18
-
19
-
20
-
21
-
22
-
23
-
24
-
25
-
26
-
27
-
28
-
29
-
30
-
31
-
32
-
33
-
34
-
 35
35 -
 36
36 -
 37
37 -
 38
38 -
 39
39 -
 40
40 -
 41
41 -
 42
42 -
 43
43 -
 44
44 -
 45
45 -
 46
46 -
 47
47 -
 48
48 -
 49
49 -
 50
50 -
 51
51 -
 52
52 -
 53
53 -
 54
54 -
 55
55 -
56
-
57
-
58
-
59
-
60
-
61
-
62
-
63
-
64
-
65
-
66
-
67
-
68
-
69
-
70
-
71
-
72
-
73
-
74
-
75
-
76
-
77
-
78
-
79
-
80
-
81
-
82
-
83
-
84
-
85
-
86
-
87
-
88
-
89
-
90
-
91
-
92
-
93
-
94
-
95
-
96
-
97
-
98
-
99
-
100
-
101
-
102
-
103
-
104
-
105
-
106
-
107
-
108
-
109
-
110
-
111
-
112
-
113
-
114
-
115
-
116
-
117
-
118
-
119
-
120
-
121
-
122
-
123
-
124
-
125
-
126
-
127
-
128
-
129
-
130
-
131
-
132
-
133
-
134
-
135
-
136
-
137
-
138
-
139
-
140
-
141
-
142
-
143
-
144
-
145
-
146
-
147
-
148
-
149
-
150
 |
 |

Table of Contents
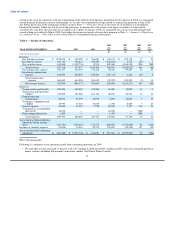
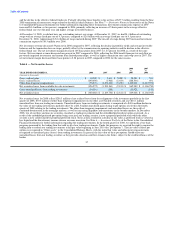
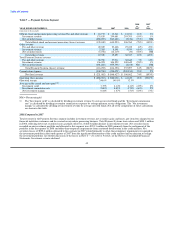
Table 6 — Global Funds Transfer Segment
2008 2007
vs. vs.
YEAR ENDED DECEMBER 31, 2008 2007 2006 2007 2006
(Amounts in thousands)
Money transfer revenue, including bill payment Fee and other revenue $ 1,000,815 $ 850,333 $ 664,712 18% 28%
Investment revenue 1,874 5,190 5,165 (64%) 0%
Net securities losses (4,100) $ (9,724) (25) (58%) NM
Total Money transfer revenue, including bill payment 998,589 845,799 669,852 18% 26%
Retail money order and other revenue
Fee and other revenue 65,781 61,053 62,885 8% (3%)
Investment revenue 24,119 88,576 89,607 (73%) (1%)
Net securities losses (45,305) (224,433) (598) (80%) NM
Total Retail money order and other revenue (losses) 44,595 (74,804) 151,894 160% (149%)
Total Global Funds Transfer revenue
Fee and other revenue 1,066,596 911,386 727,597 17% 25%
Investment revenue 25,993 93,766 94,772 (72%) (1%)
Net securities losses (49,405) (234,157) (623) (79%) NM
Total Global Funds Transfer revenue 1,043,184 770,995 821,746 35% (6%)
Commissions expense (499,819) (429,837) (333,524) 16% 29%
Net revenue $ 543,365 $ 341,158 $ 488,222 59% (30%)
Operating income (loss) $ 95,788 $ (60,410) $ 152,579 (259%) (140)%
Operating margin 9.2% (7.8)% 18.6%
NM = Not meaningful
2008 Compared to 2007
Total revenue for the Global Funds Transfer segment is comprised primarily of fees on money transfers and increased $272.2 million, or
35 percent, in 2008. Fee and other revenue increased $155.2 million, or 17 percent, driven by the growth in money transfer (including bill
payment). Investment revenue decreased $67.8 million, or 72 percent, in 2008 due to the lower yields earned on the realigned portfolio.
See "Results of Operations — Table 3 — Net Investment Revenue Analysis" for further information regarding average investable
balances and yields on the consolidated investment portfolio. Net securities losses recorded on our investment portfolio and allocated to
this segment were $49.4 million in 2008, primarily from the realignment of the portfolio in the first quarter and other-than-temporary
impairments from continued deterioration in the credit markets. Net securities losses of $234.2 million allocated to this segment in 2007
related to other-than-temporary impairments recognized in the investment portfolio in the fourth quarter from the significant deterioration
of the credit markets and our decision to realign the investment portfolio.
Money transfer (including bill payment) fee and other revenue (including bill payment) grew $150.5 million, or 18 percent, in 2008,
driven by money transfer transaction volume growth of 15 percent. This growth is the result of our network expansion and continued
targeted pricing initiatives to provide a strong consumer value proposition, supported by targeted marketing efforts. Through the third
quarter of 2008, our revenue growth exceeded our transaction growth due to changes in corridor and product mix (money transfer versus
bill payment) and the Euro exchange rate. In the fourth quarter of 2008, transaction growth of eight percent exceeded revenue growth of
six percent as the Euro exchange rate weakened and the corridor mix changed. Transaction growth for the full year
42