MoneyGram 2008 Annual Report Download - page 36
Download and view the complete annual report
Please find page 36 of the 2008 MoneyGram annual report below. You can navigate through the pages in the report by either clicking on the pages listed below, or by using the keyword search tool below to find specific information within the annual report.-
 1
1 -
2
-
3
-
4
-
5
-
6
-
7
-
8
-
9
-
10
-
11
-
12
-
13
-
14
-
15
-
16
-
17
-
18
-
19
-
20
-
21
-
22
-
23
-
24
-
25
-
 26
26 -
 27
27 -
 28
28 -
 29
29 -
 30
30 -
 31
31 -
 32
32 -
 33
33 -
 34
34 -
 35
35 -
 36
36 -
 37
37 -
 38
38 -
 39
39 -
 40
40 -
 41
41 -
 42
42 -
 43
43 -
 44
44 -
 45
45 -
 46
46 -
47
-
48
-
49
-
50
-
51
-
52
-
53
-
54
-
55
-
56
-
57
-
58
-
59
-
60
-
61
-
62
-
63
-
64
-
65
-
66
-
67
-
68
-
69
-
70
-
71
-
72
-
73
-
74
-
75
-
76
-
77
-
78
-
79
-
80
-
81
-
82
-
83
-
84
-
85
-
86
-
87
-
88
-
89
-
90
-
91
-
92
-
93
-
94
-
95
-
96
-
97
-
98
-
99
-
100
-
101
-
102
-
103
-
104
-
105
-
106
-
107
-
108
-
109
-
110
-
111
-
112
-
113
-
114
-
115
-
116
-
117
-
118
-
119
-
120
-
121
-
122
-
123
-
124
-
125
-
126
-
127
-
128
-
129
-
130
-
131
-
132
-
133
-
134
-
135
-
136
-
137
-
138
-
139
-
140
-
141
-
142
-
143
-
144
-
145
-
146
-
147
-
148
-
149
-
150
 |
 |
Table of Contents
related to the swap. In connection with our restructuring of the official check business initiated in the first quarter of 2008, we terminated
certain financial institution customer relationships. As a result, we terminated the swaps related to commission payments in June 2008.
See further discussion of the termination of these swaps in Note 7 — Derivative Financial Instruments of the Notes to Consolidated
Financial Statements. Under our sale of receivables program, we historically sold certain of our agent receivables at a discount to
accelerate our cash flow; this discount was recorded as an expense. In January 2008, we terminated our sale of receivable program and
ceased selling receivables by March 2008. See further discussion on our sale of receivables program in Note 3 — Summary of Significant
Accounting Policies — Sale of Receivables of the Notes to Consolidated Financial Statements.
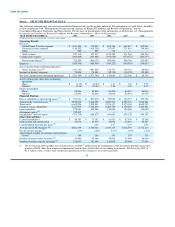
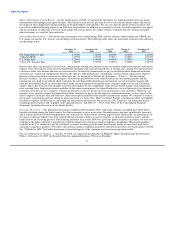
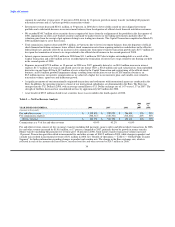
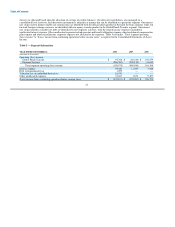
Table 1 — Results of Operations
2008 2007 2008 2007
vs. vs. vs. vs.
YEAR ENDED DECEMBER 31, 2008 2007 2006 2007 2006 2007 2006
($) ($) (%) (%)
(Amounts in thousands)
Revenue:
Fee and other revenue $ 1,105,676 $ 949,059 $ 766,881 $ 156,617 $ 182,178 17 24
Investment revenue 162,130 398,234 395,489 (236,104) 2,745 (59) 1
Net securities losses (340,688) (1,189,756) (2,811) 849,068 (1,186,945) NM NM
Total revenue 927,118 157,537 1,159,559 769,581 (1,002,022) 489 (86)
Fee commissions expense 502,317 410,301 314,418 92,016 95,883 22 30
Investment commissions
expense 102,292 253,607 249,241 (151,315) 4,366 (60) 2
Total commissions
expense 604,609 663,908 563,659 (59,299) 100,249 (9) 18
Net revenue (losses) 322,509 (506,371) 595,900 828,880 (1,102,271) 164 (185)
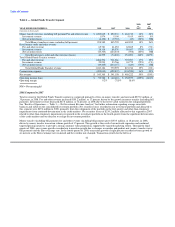
Expenses:
Compensation and benefits 224,580 188,092 172,264 36,488 15,828 19 9
Transaction and operations
support 219,905 191,066 164,122 28,839 26,944 15 16
Depreciation and
amortization 56,672 51,979 38,978 4,693 13,001 9 33
Occupancy, equipment and
supplies 45,994 44,704 35,835 1,290 8,869 3 25
Interest expense 95,020 11,055 7,928 83,965 3,127 760 39
Valuation loss on embedded
derivatives 16,030 — — 16,030 — NM —
Debt extinguishment loss 1,499 — — 1,499 — NM —
Total expenses 659,700 486,896 419,127 172,804 67,769 35 16
(Loss) income from continuing
operations before income
taxes (337,191) (993,267) 176,773 656,076 (1,170,040) 66 (662)
Income tax (benefit) expense (75,806) 78,481 52,719 154,287 (25,762) 197 (49)
(Loss) income from continuing
operations $ (261,385) $ (1,071,748) $ 124,054 $ 810,363 $ (1,195,802) 76 (964)
NM = Not meaningful
Following is a summary of our operating results from continuing operations in 2008:
• Fee and other revenue increased 17 percent to $1,105.7 million in 2008 from $949.1 million in 2007, driven by continued growth in
money transfer (including bill payment) transaction volume. Our Global Funds Transfer
33