MoneyGram 2008 Annual Report Download - page 31
Download and view the complete annual report
Please find page 31 of the 2008 MoneyGram annual report below. You can navigate through the pages in the report by either clicking on the pages listed below, or by using the keyword search tool below to find specific information within the annual report.-
 1
1 -
2
-
3
-
4
-
5
-
6
-
7
-
8
-
9
-
10
-
11
-
12
-
13
-
14
-
15
-
16
-
17
-
18
-
19
-
20
-
 21
21 -
 22
22 -
 23
23 -
 24
24 -
 25
25 -
 26
26 -
 27
27 -
 28
28 -
 29
29 -
 30
30 -
 31
31 -
 32
32 -
 33
33 -
 34
34 -
 35
35 -
 36
36 -
 37
37 -
 38
38 -
 39
39 -
 40
40 -
 41
41 -
42
-
43
-
44
-
45
-
46
-
47
-
48
-
49
-
50
-
51
-
52
-
53
-
54
-
55
-
56
-
57
-
58
-
59
-
60
-
61
-
62
-
63
-
64
-
65
-
66
-
67
-
68
-
69
-
70
-
71
-
72
-
73
-
74
-
75
-
76
-
77
-
78
-
79
-
80
-
81
-
82
-
83
-
84
-
85
-
86
-
87
-
88
-
89
-
90
-
91
-
92
-
93
-
94
-
95
-
96
-
97
-
98
-
99
-
100
-
101
-
102
-
103
-
104
-
105
-
106
-
107
-
108
-
109
-
110
-
111
-
112
-
113
-
114
-
115
-
116
-
117
-
118
-
119
-
120
-
121
-
122
-
123
-
124
-
125
-
126
-
127
-
128
-
129
-
130
-
131
-
132
-
133
-
134
-
135
-
136
-
137
-
138
-
139
-
140
-
141
-
142
-
143
-
144
-
145
-
146
-
147
-
148
-
149
-
150
 |
 |
Table of Contents
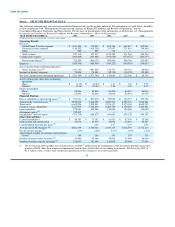
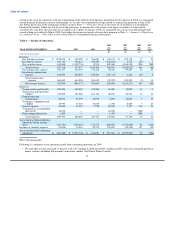
Item 6. SELECTED FINANCIAL DATA
The following table presents our selected consolidated financial data for the periods indicated. The information set forth below should be
read in conjunction with "Management's Discussion and Analysis of Financial Condition and Results of Operations" and our
Consolidated Financial Statements and Notes thereto. For the basis of presentation of the information set forth below, see "Management's
Discussion and Analysis of Financial Condition and Results of Operations — Basis of Presentation."
YEAR ENDED DECEMBER 31, 2008 2007 2006 2005 2004
(Dollars and shares in thousands, except per share data)
Operating Results
Revenue
Global Funds Transfer segment $ 1,043,184 $ 770,995 $ 821,746 $ 649,617 $ 532,064
Payment Systems segment (116,292) (614,356) 337,097 321,619 294,466
Other 226 898 716 — —
Total revenue 927,118 157,537 1,159,559 971,236 826,530
Commissions expense (604,609) (663,908) (563,659) (470,472) (403,473)
Net revenue (losses) (1) 322,509 (506,371) 595,900 500,764 423,057
Expenses (659,700) (486,896) (419,127) (354,388) (334,037)
(Loss) income from continuing operations
before income taxes (2) (337,191) (993,267) 176,773 146,376 89,020
Income tax benefit (expense) 75,806 (78,481) (52,719) (34,170) (23,891)
Net (loss) income from continuing operations $ (261,385) $ (1,071,748) $ 124,054 $ 112,206 $ 65,129
(Loss) earnings per share from continuing
operations:
Basic $ (4.19) $ (12.94) $ 1.47 $ 1.32 $ 0.75
Diluted (4.19) (12.94) 1.45 1.30 0.75
Shares outstanding
Basic 82,456 82,818 84,294 84,675 86,916
Diluted 82,456 82,818 85,818 85,970 87,330
Financial Position
Excess (shortfall) in unrestricted assets (3) $ 391,031 $ (551,812) $ 358,924 $ 366,037 $ 393,920
Substantially restricted assets (3) 5,829,030 7,210,658 8,568,713 8,525,346 7,640,581
Total assets 6,642,296 7,935,011 9,276,137 9,175,164 8,630,735
Payment service obligations 5,437,999 7,762,470 8,209,789 8,159,309 7,640,581
Long-term debt 978,881 345,000 150,000 150,000 150,000
Mezzanine equity (4) 742,212 — — — —
Stockholders' (deficit) equity (781,736) (488,517) 669,063 624,129 565,191
Other Selected Data
Capital expenditures $ 40,357 $ 71,142 $ 81,033 $ 47,359 $ 29,589
Depreciation and amortization 56,672 51,979 38,978 32,465 29,567
Cash dividends declared per share (5) — 0.20 0.17 0.07 0.20
Average investable balances (6) 4,866,339 6,346,442 6,333,115 6,726,790 6,772,124
Net investment margin (7) 1.23% 2.28% 2.31% 1.91% 1.42%
Approximate number of countries and territories
served 189 180 170 170 170
Number of money order locations (8) 59,000 59,000 55,000 53,000 54,000
Number of money transfer locations (8) 176,000 143,000 110,000 89,000 77,000
(1) Net revenue for 2008 includes net securities losses of $340.7 million from the realignment of the investment portfolio in the first
quarter of 2008, other-than-temporary impairments and declines in the value of our trading investments. Net losses for 2007 of
$1.2 billion relates to other-than-temporary impairments in the Company's investment portfolio.
28