MoneyGram 2008 Annual Report Download - page 30
Download and view the complete annual report
Please find page 30 of the 2008 MoneyGram annual report below. You can navigate through the pages in the report by either clicking on the pages listed below, or by using the keyword search tool below to find specific information within the annual report.-
 1
1 -
2
-
3
-
4
-
5
-
6
-
7
-
8
-
9
-
10
-
11
-
12
-
13
-
14
-
15
-
16
-
17
-
18
-
19
-
 20
20 -
 21
21 -
 22
22 -
 23
23 -
 24
24 -
 25
25 -
 26
26 -
 27
27 -
 28
28 -
 29
29 -
 30
30 -
 31
31 -
 32
32 -
 33
33 -
 34
34 -
 35
35 -
 36
36 -
 37
37 -
 38
38 -
 39
39 -
 40
40 -
41
-
42
-
43
-
44
-
45
-
46
-
47
-
48
-
49
-
50
-
51
-
52
-
53
-
54
-
55
-
56
-
57
-
58
-
59
-
60
-
61
-
62
-
63
-
64
-
65
-
66
-
67
-
68
-
69
-
70
-
71
-
72
-
73
-
74
-
75
-
76
-
77
-
78
-
79
-
80
-
81
-
82
-
83
-
84
-
85
-
86
-
87
-
88
-
89
-
90
-
91
-
92
-
93
-
94
-
95
-
96
-
97
-
98
-
99
-
100
-
101
-
102
-
103
-
104
-
105
-
106
-
107
-
108
-
109
-
110
-
111
-
112
-
113
-
114
-
115
-
116
-
117
-
118
-
119
-
120
-
121
-
122
-
123
-
124
-
125
-
126
-
127
-
128
-
129
-
130
-
131
-
132
-
133
-
134
-
135
-
136
-
137
-
138
-
139
-
140
-
141
-
142
-
143
-
144
-
145
-
146
-
147
-
148
-
149
-
150
 |
 |
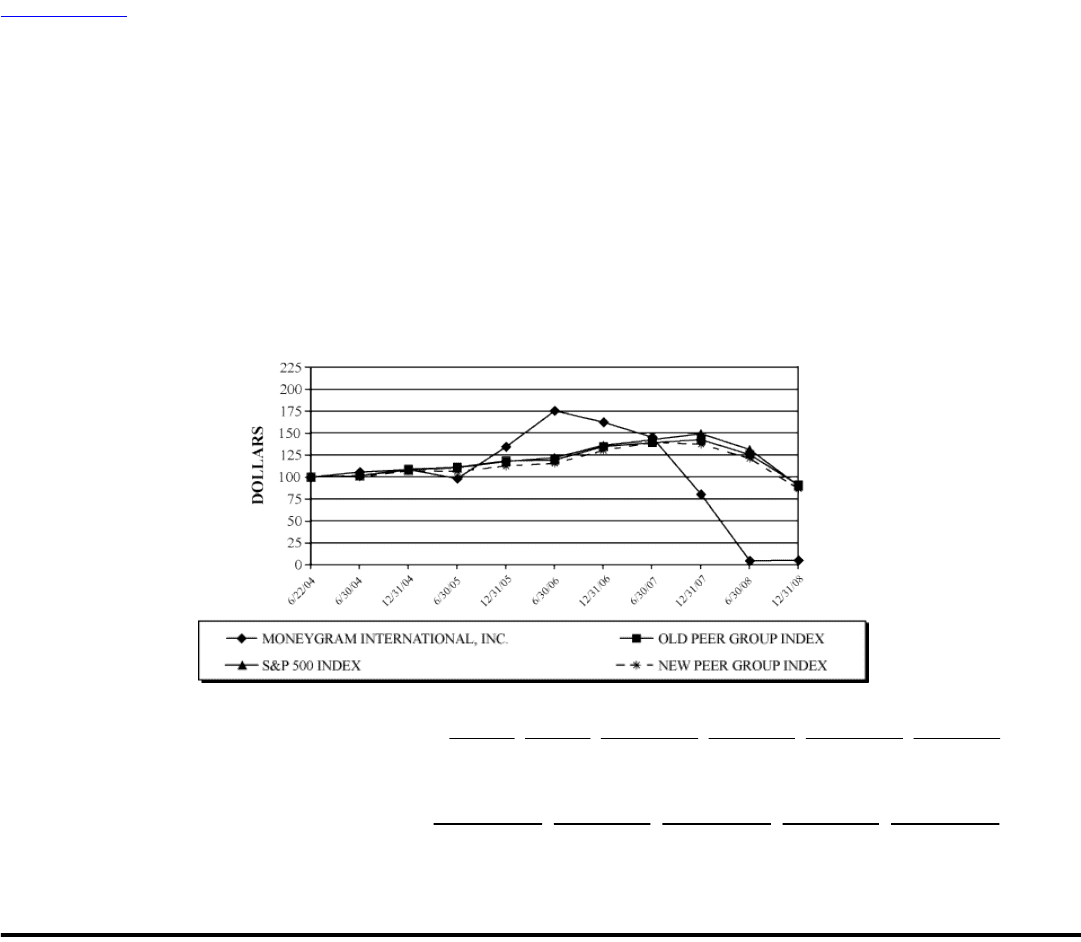
Table of Contents
STOCKHOLDER RETURN PERFORMANCE
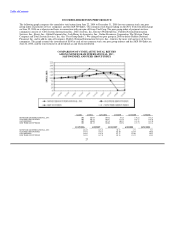
The following graph compares the cumulative total return from June 22, 2004 to December 31, 2008 for our common stock, our peer
group index of payment services companies and the S&P 500 Index. Our common stock began trading on the New York Stock Exchange
on June 22, 2004 on a when-issued basis in connection with our spin-off from Viad Corp. The peer group index of payment services
companies consists of: CSG Systems International Inc., DST Systems, Inc., Euronet Worldwide Inc., Fidelity National Information
Services, Inc., Fiserv, Inc., Global Payments Inc., Jack Henry & Associates, Inc., Online Resources Corporation, The Western Union
Company and Total System Services, Inc. (the "Peer Group Index"). We changed our peer group in 2008 to delete Fidelity National
Financial, Inc. and to add its spin-off company, Fidelity National Information Services, Inc., which is the more relevant peer of the two
companies. The graph assumes the investment of $100 in each of our common stock, our peer group indexes and the S&P 500 Index on
June 22, 2004, and the reinvestment of all dividends as and when distributed.
COMPARISON OF CUMULATIVE TOTAL RETURN
AMONG MONEYGRAM INTERNATIONAL, INC.,
S&P 500 INDEX AND PEER GROUP INDEX
6/22/04 6/30/04 12/31/2004 6/30/2005 12/30/2005 6/30/2006
MONEYGRAM INTERNATIONAL, INC. 100 105.64 108.53 98.25 134.28 175.27
OLD PEER GROUP INDEX 100 101.44 108.97 111.14 118.37 119.29
S&P 500 INDEX 100 100.00 107.19 106.32 112.46 115.50
NEW PEER GROUP INDEX 100 101.45 108.04 110.54 117.74 122.14
12/29/2006 6/29/2007 12/31/2007 6/30/2008 12/31/2008
MONEYGRAM INTERNATIONAL, INC. 162.35 145.22 80.32 4.71 5.33
OLD PEER GROUP INDEX 134.71 139.13 142.50 125.48 90.86
S&P 500 INDEX 130.22 139.28 137.37 121.01 86.55
NEW PEER GROUP INDEX 136.13 142.39 149.26 131.22 89.99
27