MoneyGram 2008 Annual Report Download - page 116
Download and view the complete annual report
Please find page 116 of the 2008 MoneyGram annual report below. You can navigate through the pages in the report by either clicking on the pages listed below, or by using the keyword search tool below to find specific information within the annual report.-
 1
1 -
2
-
3
-
4
-
5
-
6
-
7
-
8
-
9
-
10
-
11
-
12
-
13
-
14
-
15
-
16
-
17
-
18
-
19
-
20
-
21
-
22
-
23
-
24
-
25
-
26
-
27
-
28
-
29
-
30
-
31
-
32
-
33
-
34
-
35
-
36
-
37
-
38
-
39
-
40
-
41
-
42
-
43
-
44
-
45
-
46
-
47
-
48
-
49
-
50
-
51
-
52
-
53
-
54
-
55
-
56
-
57
-
58
-
59
-
60
-
61
-
62
-
63
-
64
-
65
-
66
-
67
-
68
-
69
-
70
-
71
-
72
-
73
-
74
-
75
-
76
-
77
-
78
-
79
-
80
-
81
-
82
-
83
-
84
-
85
-
86
-
87
-
88
-
89
-
90
-
91
-
92
-
93
-
94
-
95
-
96
-
97
-
98
-
99
-
100
-
101
-
102
-
103
-
104
-
105
-
 106
106 -
 107
107 -
 108
108 -
 109
109 -
 110
110 -
 111
111 -
 112
112 -
 113
113 -
 114
114 -
 115
115 -
 116
116 -
 117
117 -
 118
118 -
 119
119 -
 120
120 -
 121
121 -
 122
122 -
 123
123 -
 124
124 -
 125
125 -
 126
126 -
127
-
128
-
129
-
130
-
131
-
132
-
133
-
134
-
135
-
136
-
137
-
138
-
139
-
140
-
141
-
142
-
143
-
144
-
145
-
146
-
147
-
148
-
149
-
150
 |
 |

Table of Contents
MONEYGRAM INTERNATIONAL, INC. AND SUBSIDIARIES
NOTES TO CONSOLIDATED FINANCIAL STATEMENTS — (Continued)
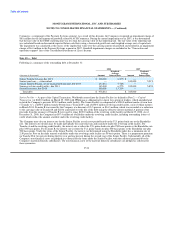
for proceeds of $2.9 billion and a net realized loss of $256.3 million. This net realized loss is the result of further deterioration in the
markets during the first quarter of 2008 and the short timeframe over which the Company sold its securities. Proceeds from the sales of
$2.9 billion were reinvested in cash and cash equivalents. The Company recognized an other-than-temporary impairment charge of
$70.3 million during 2008 as the result of further deterioration in the markets and securities.
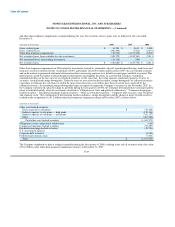
The net unrealized losses from trading investments in 2008 are comprised of unrealized losses on trading investments of $40.6 million net
of an unrealized gain recognized for the put options related to the trading investments of $26.5 million. Due to the classification of these
investments, the unrealized gains and losses are recognized in the Company's Consolidated Statements of (Loss) Income.
At December 31, 2008, approximately 90 percent of the available-for-sale portfolio is invested in debentures of U.S. government
agencies or securities collateralized by U.S government agency debentures. These securities have always had the implicit backing of the
U.S. government. During the third quarter of 2008, the U.S. government took action to place certain agencies under conservatorship and
provide unlimited lines of credit through the U.S. Treasury. These actions served to provide greater comfort to the market regarding the
intent of the U.S. government to back the securities issued by its agencies. The Company expects to receive full par value of the securities
upon maturity or pay-down, as well as all interest payments, on these securities. The "Other asset-backed securities," comprising seven
percent of the available-for-sale portfolio at a fair value of $29.5 million, continue to have market exposure. The Company has factored
this risk into its fair value estimates, with the average price of an asset-backed security at $0.04 per dollar of par.
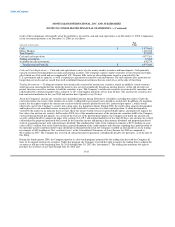
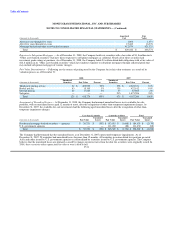
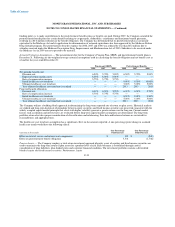
Investment Ratings: In rating the securities in its investment portfolio, the Company uses ratings from Moody's Investor Service
("Moody's"), Standard & Poors ("S&P") and Fitch Ratings ("Fitch"). If the rating agencies have split ratings, the Company uses the
highest rating from either Moody's or S&P for disclosure purposes. Securities issued or backed by U.S. government agencies are included
in the AAA rating category. Investment grade is defined as a security having a Moody's equivalent rating of Aaa, Aa, A or Baa or an S&P
or Fitch equivalent rating of AAA, AA, A or BBB. The Company's investments at December 31 consisted of the following ratings:
2008 2007
Number of % of Total Number of % of Total
(Amounts in thousands) Securities Fair Value Portfolio Securities Fair Value Portfolio
AAA, including U.S. agencies 42 $ 409,672 94% 287 $ 2,410,548 58%
AA 3 5,064 0% 172 944,804 22%
A 5 2,919 1% 134 668,120 16%
BBB 2 543 0% 11 41,701 1%
Below investment grade 68 20,576 5% 66 122,211 3%
Total 120 $ 438,774 100% 670 $ 4,187,384 100%
Had the Company used the lowest rating from either Moody's or S&P in the information presented above, investments rated A or better
would have been reduced by $3.5 million and $32.2 million as of December 31, 2008 and 2007, respectively.
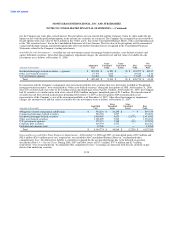
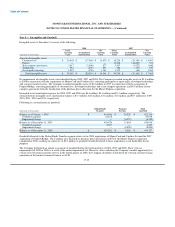
Contractual Maturities: The amortized cost and fair value of available-for-sale securities at December 31, 2008, by contractual maturity,
are shown below. Actual maturities may differ from contractual maturities as borrowers may have the right to call or prepay obligations,
sometimes without call or prepayment penalties. Maturities of mortgage-backed and other asset-backed securities depend on the
repayment characteristics and experience of the underlying obligations.
F-30