MoneyGram 2008 Annual Report Download - page 141
Download and view the complete annual report
Please find page 141 of the 2008 MoneyGram annual report below. You can navigate through the pages in the report by either clicking on the pages listed below, or by using the keyword search tool below to find specific information within the annual report.-
 1
1 -
2
-
3
-
4
-
5
-
6
-
7
-
8
-
9
-
10
-
11
-
12
-
13
-
14
-
15
-
16
-
17
-
18
-
19
-
20
-
21
-
22
-
23
-
24
-
25
-
26
-
27
-
28
-
29
-
30
-
31
-
32
-
33
-
34
-
35
-
36
-
37
-
38
-
39
-
40
-
41
-
42
-
43
-
44
-
45
-
46
-
47
-
48
-
49
-
50
-
51
-
52
-
53
-
54
-
55
-
56
-
57
-
58
-
59
-
60
-
61
-
62
-
63
-
64
-
65
-
66
-
67
-
68
-
69
-
70
-
71
-
72
-
73
-
74
-
75
-
76
-
77
-
78
-
79
-
80
-
81
-
82
-
83
-
84
-
85
-
86
-
87
-
88
-
89
-
90
-
91
-
92
-
93
-
94
-
95
-
96
-
97
-
98
-
99
-
100
-
101
-
102
-
103
-
104
-
105
-
106
-
107
-
108
-
109
-
110
-
111
-
112
-
113
-
114
-
115
-
116
-
117
-
118
-
119
-
120
-
121
-
122
-
123
-
124
-
125
-
126
-
127
-
128
-
129
-
130
-
 131
131 -
 132
132 -
 133
133 -
 134
134 -
 135
135 -
 136
136 -
 137
137 -
 138
138 -
 139
139 -
 140
140 -
 141
141 -
 142
142 -
 143
143 -
 144
144 -
 145
145 -
 146
146 -
 147
147 -
 148
148 -
 149
149 -
 150
150
 |
 |

Table of Contents
MONEYGRAM INTERNATIONAL, INC. AND SUBSIDIARIES
NOTES TO CONSOLIDATED FINANCIAL STATEMENTS — (Continued)
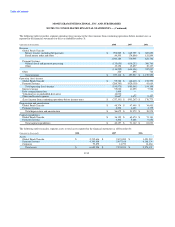
The following table reconciles segment operating (loss) income to the (loss) income from continuing operations before income taxes as
reported in the financial statements for the year ended December 31:
(Amounts in thousands) 2008 2007 2006
Revenue
Global Funds Transfer:
Money transfer, including bill payment $ 998,589 $ 845,799 $ 669,852
Retail money order and other 44,595 (74,804) 151,894
1,043,184 770,995 821,746
Payment Systems:
Official check and payment processing (135,650) (630,253) 306,760
Other 19,358 15,897 30,337
(116,292) (614,356) 337,097
Other 226 898 716
Total revenue $ 927,118 $ 157,537 $ 1,159,559
Operating (loss) income
Global Funds Transfer $ 95,788 $ (60,410) $ 152,579
Payment Systems (286,763) (920,130) 41,619
Total operating (loss) income (190,975) (980,540) 194,198
Interest expense 95,020 11,055 7,928
Debt extinguishment loss 1,499 — —
Valuation loss on embedded derivatives 16,030 — —
Other unallocated expenses 33,667 1,672 9,497
(Loss) income from continuing operations before income taxes $ (337,191) $ (993,267) $ 176,773
Depreciation and amortization
Global Funds Transfer $ 48,374 $ 47,499 $ 34,603
Payment Systems 8,298 4,480 4,375
Total depreciation and amortization $ 56,672 $ 51,979 $ 38,978
Capital expenditures
Global Funds Transfer $ 36,155 $ 65,474 $ 71,181
Payment Systems 4,202 5,668 9,852
Total capital expenditures $ 40,357 $ 71,142 $ 81,033
The following table reconciles segment assets to total assets reported in the financial statements as of December 31:
(Amounts in thousands) 2008 2007 2006
Assets
Global Funds Transfer $ 2,212,616 $ 2,423,090 $ 3,091,519
Payment Systems 4,349,808 5,497,168 6,168,134
Corporate 79,872 14,753 16,484
Total assets $ 6,642,296 $ 7,935,011 $ 9,276,137
F-55