Experian 2016 Annual Report Download - page 93
Download and view the complete annual report
Please find page 93 of the 2016 Experian annual report below. You can navigate through the pages in the report by either clicking on the pages listed below, or by using the keyword search tool below to find specific information within the annual report.-
 1
1 -
2
-
3
-
4
-
5
-
6
-
7
-
8
-
9
-
10
-
11
-
12
-
13
-
14
-
15
-
16
-
17
-
18
-
19
-
20
-
21
-
22
-
23
-
24
-
25
-
26
-
27
-
28
-
29
-
30
-
31
-
32
-
33
-
34
-
35
-
36
-
37
-
38
-
39
-
40
-
41
-
42
-
43
-
44
-
45
-
46
-
47
-
48
-
49
-
50
-
51
-
52
-
53
-
54
-
55
-
56
-
57
-
58
-
59
-
60
-
61
-
62
-
63
-
64
-
65
-
66
-
67
-
68
-
69
-
70
-
71
-
72
-
73
-
74
-
75
-
76
-
77
-
78
-
79
-
80
-
81
-
82
-
 83
83 -
 84
84 -
 85
85 -
 86
86 -
 87
87 -
 88
88 -
 89
89 -
 90
90 -
 91
91 -
 92
92 -
 93
93 -
 94
94 -
 95
95 -
 96
96 -
 97
97 -
 98
98 -
 99
99 -
 100
100 -
 101
101 -
 102
102 -
 103
103 -
104
-
105
-
106
-
107
-
108
-
109
-
110
-
111
-
112
-
113
-
114
-
115
-
116
-
117
-
118
-
119
-
120
-
121
-
122
-
123
-
124
-
125
-
126
-
127
-
128
-
129
-
130
-
131
-
132
-
133
-
134
-
135
-
136
-
137
-
138
-
139
-
140
-
141
-
142
-
143
-
144
-
145
-
146
-
147
-
148
-
149
-
150
-
151
-
152
-
153
-
154
-
155
-
156
-
157
-
158
-
159
-
160
-
161
-
162
-
163
-
164
-
165
-
166
-
167
-
168
-
169
-
170
-
171
-
172
-
173
-
174
-
175
-
176
-
177
-
178
-
179
-
180
-
181
-
182
-
183
-
184
-
185
-
186
-
187
-
188
 |
 |
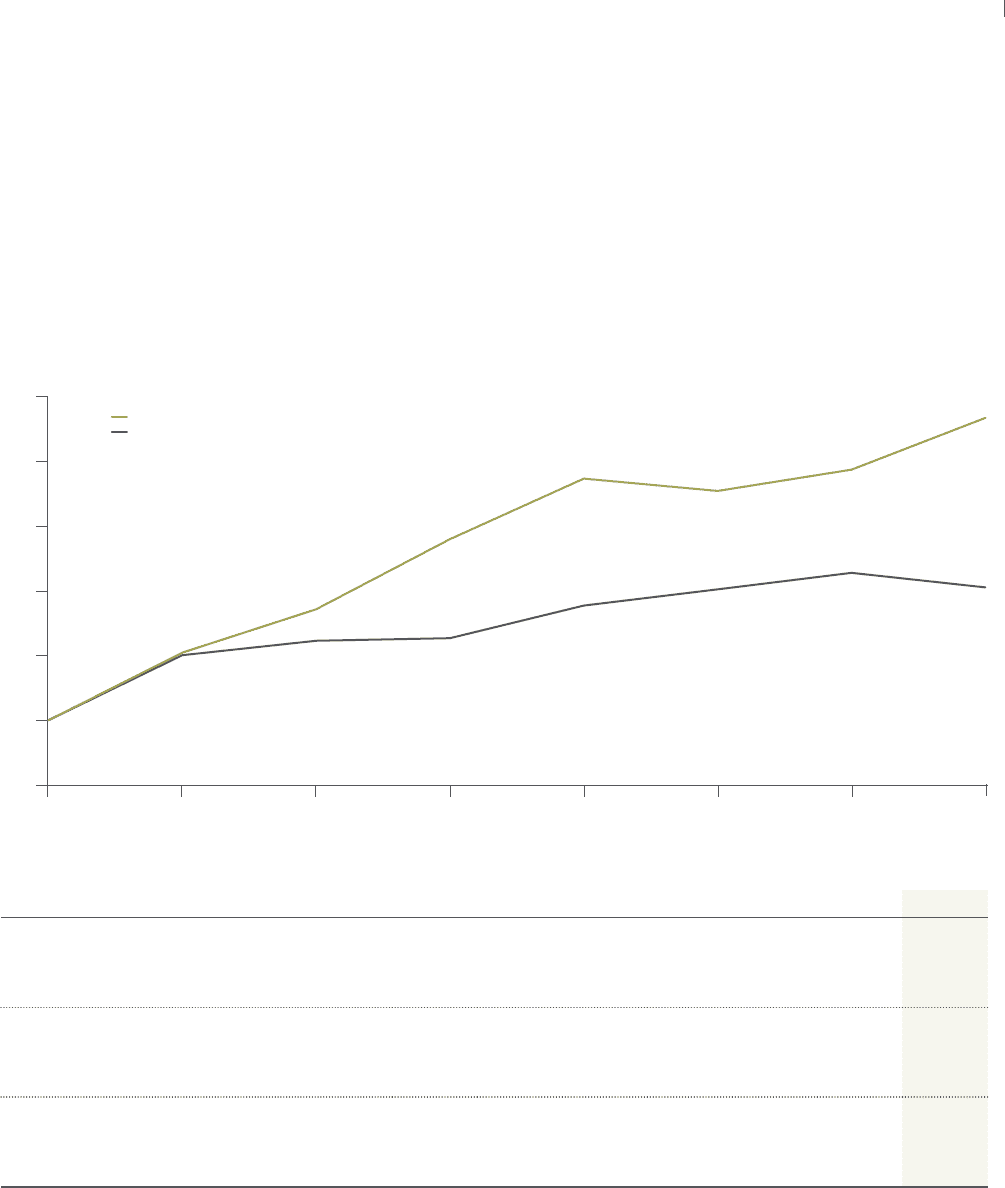
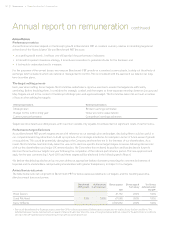
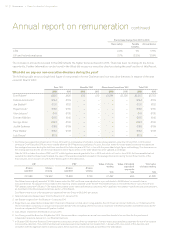
How is our CEO’s pay linked to Experian’s performance? (not audited)
The chart below shows Experian’s annual TSR performance against the FTSE 100 Index over the last seven years. The FTSE 100 Index
is the most appropriate index against which TSR should be measured, as it is widely used and understood. Experian is a constituent
of the index.
Value of £100 invested in Experian and the FTSE 100 on 31 March 2009
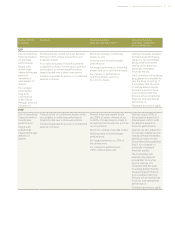
The pay for the CEO for each of the last seven financial years was as follows:
Year 2010 2011 2012 2013 2014 2015 2016
CEO total single figure of remuneration (’000)
Don Robert US$6,729 US$5,714 US$23,206 US$22,974 US$16,290 US$620 –
Brian Cassin – – – – – £1,976 £3,592
Annual bonus paid against maximum opportunity (%)
Don Robert 100% 98% 100% 75% 50% ––
Brian Cassin – – – – – 38% 100%
LTIP vesting against maximum opportunity (%)
Don Robert 70% n/a1100% 100% 94% 69% –
Brian Cassin – – – – – 40% 33%
1 No long-term incentive plan awards vested in respect of performance periods ending in 2011.
How has the CEO’s pay changed compared to the wider workforce? (not audited)
The following table sets out the percentage change in the CEO’s salary, benefits and annual bonus between 2015 and 2016, and how
this compares to the average percentage change for our UK and Ireland employees. Consistent with the approach used in previous
years, the Committee has selected this group of employees to illustrate the comparison because Experian is a UK listed company
and has widely varying approaches to pay across different geographic regions. This also avoids the complexities, including the
impact of foreign exchange rate movements, involved in collating remuneration data across different geographic populations. As an
example of the varying practices across the different countries in which we operate, salary review budgets for 2016 ranged between
1.7% and 25%.
Brian Cassin was appointed CEO part-way through 2015 and in order to provide a comparison with the full-year figures for 2016 his
salary, benefits and annual bonus for the period between 16 July 2014 and 31 March 2015 have been annualised.
The figures for UK and Ireland employees reflect average salaries and average employee numbers each year. The annual bonus
figure includes payments from sales incentive plans.
£50
£100
2009 2010 2011 2012 2013 20152014 2016
£200
£150
£250
£350
Experian
FTSE 100
£300
91Governance •Report on directors’ remuneration