Experian 2016 Annual Report Download - page 150
Download and view the complete annual report
Please find page 150 of the 2016 Experian annual report below. You can navigate through the pages in the report by either clicking on the pages listed below, or by using the keyword search tool below to find specific information within the annual report.-
 1
1 -
2
-
3
-
4
-
5
-
6
-
7
-
8
-
9
-
10
-
11
-
12
-
13
-
14
-
15
-
16
-
17
-
18
-
19
-
20
-
21
-
22
-
23
-
24
-
25
-
26
-
27
-
28
-
29
-
30
-
31
-
32
-
33
-
34
-
35
-
36
-
37
-
38
-
39
-
40
-
41
-
42
-
43
-
44
-
45
-
46
-
47
-
48
-
49
-
50
-
51
-
52
-
53
-
54
-
55
-
56
-
57
-
58
-
59
-
60
-
61
-
62
-
63
-
64
-
65
-
66
-
67
-
68
-
69
-
70
-
71
-
72
-
73
-
74
-
75
-
76
-
77
-
78
-
79
-
80
-
81
-
82
-
83
-
84
-
85
-
86
-
87
-
88
-
89
-
90
-
91
-
92
-
93
-
94
-
95
-
96
-
97
-
98
-
99
-
100
-
101
-
102
-
103
-
104
-
105
-
106
-
107
-
108
-
109
-
110
-
111
-
112
-
113
-
114
-
115
-
116
-
117
-
118
-
119
-
120
-
121
-
122
-
123
-
124
-
125
-
126
-
127
-
128
-
129
-
130
-
131
-
132
-
133
-
134
-
135
-
136
-
137
-
138
-
139
-
 140
140 -
 141
141 -
 142
142 -
 143
143 -
 144
144 -
 145
145 -
 146
146 -
 147
147 -
 148
148 -
 149
149 -
 150
150 -
 151
151 -
 152
152 -
 153
153 -
 154
154 -
 155
155 -
 156
156 -
 157
157 -
 158
158 -
 159
159 -
 160
160 -
161
-
162
-
163
-
164
-
165
-
166
-
167
-
168
-
169
-
170
-
171
-
172
-
173
-
174
-
175
-
176
-
177
-
178
-
179
-
180
-
181
-
182
-
183
-
184
-
185
-
186
-
187
-
188
 |
 |

148
Notes to the Group financial statements continued
for the year ended 31 March 2016
Financial statements •Notes to the Group nancial statements
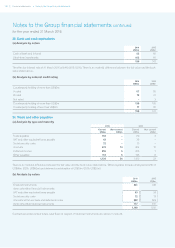
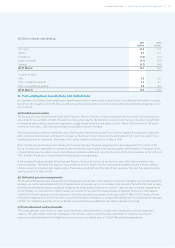
23. Cash and cash equivalents
(a) Analysis by nature
2016
US$m
2015
US$m
Cash at bank and in hand 53 66
Short-term investments 103 81
156 147
The effective interest rate at 31 March 2016 is 8.4% (2015: 6.0%). There is no material difference between the fair value and the book
value stated above.
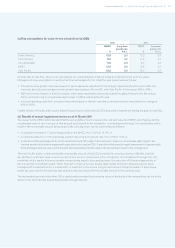
(b) Analysis by external credit rating
2016
US$m
2015
US$m
Counterparty holding of more than US$2m:
A rated 67 52
B rated 72 70
Not rated – 3
Counterparty holding of more than US$2m 139 125
Counterparty holding of less than US$2m 17 22
156 147
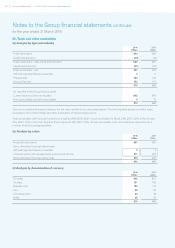
24. Trade and other payables
(a) Analysis by type and maturity
2016 2015
Current
US$m
Non-current
US$m
Current
US$m
Non-current
US$m
Trade payables 163 –119 3
VAT and other equivalent taxes payable 43 – 35 –
Social security costs 72 – 73 –
Accruals 473 14 464 15
Deferred income 259 5 306 7
Other payables 114 5 125 8
1,124 24 1,122 33
There is no material difference between the fair value and the book value stated above. Other payables include employee benefits of
US$68m (2015: US$80m) and deferred consideration of US$10m (2015: US$22m).
(b) Analysis by nature
2016
US$m
2015
US$m
Financial instruments 431 418
Items other than financial instruments:
VAT and other equivalent taxes payable 43 35
Social security costs 72 73
Amounts within accruals and deferred income 602 629
Items other than financial instruments 717 737
1,148 1,155
Contractual undiscounted future cash flows in respect of financial instruments are shown in note 29.