Experian 2016 Annual Report Download - page 146
Download and view the complete annual report
Please find page 146 of the 2016 Experian annual report below. You can navigate through the pages in the report by either clicking on the pages listed below, or by using the keyword search tool below to find specific information within the annual report.-
 1
1 -
2
-
3
-
4
-
5
-
6
-
7
-
8
-
9
-
10
-
11
-
12
-
13
-
14
-
15
-
16
-
17
-
18
-
19
-
20
-
21
-
22
-
23
-
24
-
25
-
26
-
27
-
28
-
29
-
30
-
31
-
32
-
33
-
34
-
35
-
36
-
37
-
38
-
39
-
40
-
41
-
42
-
43
-
44
-
45
-
46
-
47
-
48
-
49
-
50
-
51
-
52
-
53
-
54
-
55
-
56
-
57
-
58
-
59
-
60
-
61
-
62
-
63
-
64
-
65
-
66
-
67
-
68
-
69
-
70
-
71
-
72
-
73
-
74
-
75
-
76
-
77
-
78
-
79
-
80
-
81
-
82
-
83
-
84
-
85
-
86
-
87
-
88
-
89
-
90
-
91
-
92
-
93
-
94
-
95
-
96
-
97
-
98
-
99
-
100
-
101
-
102
-
103
-
104
-
105
-
106
-
107
-
108
-
109
-
110
-
111
-
112
-
113
-
114
-
115
-
116
-
117
-
118
-
119
-
120
-
121
-
122
-
123
-
124
-
125
-
126
-
127
-
128
-
129
-
130
-
131
-
132
-
133
-
134
-
135
-
 136
136 -
 137
137 -
 138
138 -
 139
139 -
 140
140 -
 141
141 -
 142
142 -
 143
143 -
 144
144 -
 145
145 -
 146
146 -
 147
147 -
 148
148 -
 149
149 -
 150
150 -
 151
151 -
 152
152 -
 153
153 -
 154
154 -
 155
155 -
 156
156 -
157
-
158
-
159
-
160
-
161
-
162
-
163
-
164
-
165
-
166
-
167
-
168
-
169
-
170
-
171
-
172
-
173
-
174
-
175
-
176
-
177
-
178
-
179
-
180
-
181
-
182
-
183
-
184
-
185
-
186
-
187
-
188
 |
 |
144
Notes to the Group financial statements continued
for the year ended 31 March 2016
Financial statements •Notes to the Group nancial statements
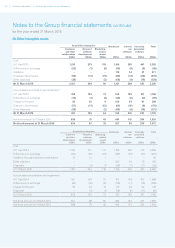
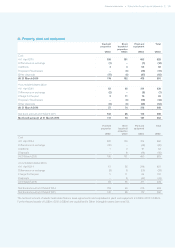
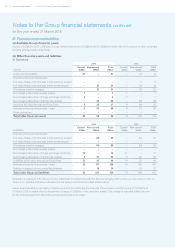
20. Other intangible assets
Acquisition intangibles Databases
US$m
Internal
use
software
US$m
Internally
generated
software
US$m
Total
US$m
Customer
and other
relationships
US$m
Acquired
software
development
US$m
Marketing-
related
assets
US$m
Cost
At 1 April 2015 1,151 233 118 1,149 300 441 3,392
Differences on exchange (33) (7) (5) (40) (9) (5) (99)
Additions – – – 176 34 61 271
Disposal of businesses (59) (17) (15) (86) (13) (20) (210)
Other disposals (38) –(2) (68) (4) (16) (128)
At 31 March 2016 1,021 209 96 1,131 308 461 3,226
Accumulated amortisation and impairment
At 1 April 2015 453 155 73 705 185 197 1,768
Differences on exchange (16) (7) (4) (30) (5) (3) (65)
Charge for the year 85 25 9 160 49 61 389
Disposal of businesses (57) (17) (12) (63) (12) (9) (170)
Other disposals (38) –(2) (68) (4) (15) (127)
At 31 March 2016 427 156 64 704 213 231 1,795
Net book amount at 31 March 2015 698 78 45 444 115 244 1,624
Net book amount at 31 March 2016 594 53 32 427 95 230 1,431
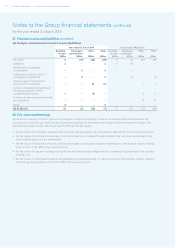
Acquisition intangibles Databases
US$m
Internal
use
software
US$m
Internally
generated
software
US$m
Total
US$m
Customer
and other
relationships
US$m
Acquired
software
development
US$m
Marketing-
related
assets
US$m
Cost
At 1 April 2014 1,262 261 141 1,18 9 293 412 3,558
Differences on exchange (124) (35) (23) (183) (30) (30) (425)
Additions through business combinations 13 12 1 – – – 26
Other additions – – – 202 44 70 316
Disposals – (5) (1) (59) (7) (11) (83)
At 31 March 2015 1,151 233 118 1,149 300 441 3,392
Accumulated amortisation and impairment
At 1 April 2014 421 163 76 705 159 165 1,689
Differences on exchange (60) (32) (15) (118) (17) (16) (258)
Charge for the year 92 29 13 176 49 59 418
Disposals – (5) (1) (58) (6) (11) (81)
At 31 March 2015 453 155 73 705 185 197 1,768
Net book amount at 31 March 2014 841 98 65 484 134 247 1,869
Net book amount at 31 March 2015 698 78 45 444 115 244 1,624