Experian 2016 Annual Report Download - page 39
Download and view the complete annual report
Please find page 39 of the 2016 Experian annual report below. You can navigate through the pages in the report by either clicking on the pages listed below, or by using the keyword search tool below to find specific information within the annual report.-
 1
1 -
2
-
3
-
4
-
5
-
6
-
7
-
8
-
9
-
10
-
11
-
12
-
13
-
14
-
15
-
16
-
17
-
18
-
19
-
20
-
21
-
22
-
23
-
24
-
25
-
26
-
27
-
28
-
 29
29 -
 30
30 -
 31
31 -
 32
32 -
 33
33 -
 34
34 -
 35
35 -
 36
36 -
 37
37 -
 38
38 -
 39
39 -
 40
40 -
 41
41 -
 42
42 -
 43
43 -
 44
44 -
 45
45 -
 46
46 -
 47
47 -
 48
48 -
 49
49 -
50
-
51
-
52
-
53
-
54
-
55
-
56
-
57
-
58
-
59
-
60
-
61
-
62
-
63
-
64
-
65
-
66
-
67
-
68
-
69
-
70
-
71
-
72
-
73
-
74
-
75
-
76
-
77
-
78
-
79
-
80
-
81
-
82
-
83
-
84
-
85
-
86
-
87
-
88
-
89
-
90
-
91
-
92
-
93
-
94
-
95
-
96
-
97
-
98
-
99
-
100
-
101
-
102
-
103
-
104
-
105
-
106
-
107
-
108
-
109
-
110
-
111
-
112
-
113
-
114
-
115
-
116
-
117
-
118
-
119
-
120
-
121
-
122
-
123
-
124
-
125
-
126
-
127
-
128
-
129
-
130
-
131
-
132
-
133
-
134
-
135
-
136
-
137
-
138
-
139
-
140
-
141
-
142
-
143
-
144
-
145
-
146
-
147
-
148
-
149
-
150
-
151
-
152
-
153
-
154
-
155
-
156
-
157
-
158
-
159
-
160
-
161
-
162
-
163
-
164
-
165
-
166
-
167
-
168
-
169
-
170
-
171
-
172
-
173
-
174
-
175
-
176
-
177
-
178
-
179
-
180
-
181
-
182
-
183
-
184
-
185
-
186
-
187
-
188
 |
 |
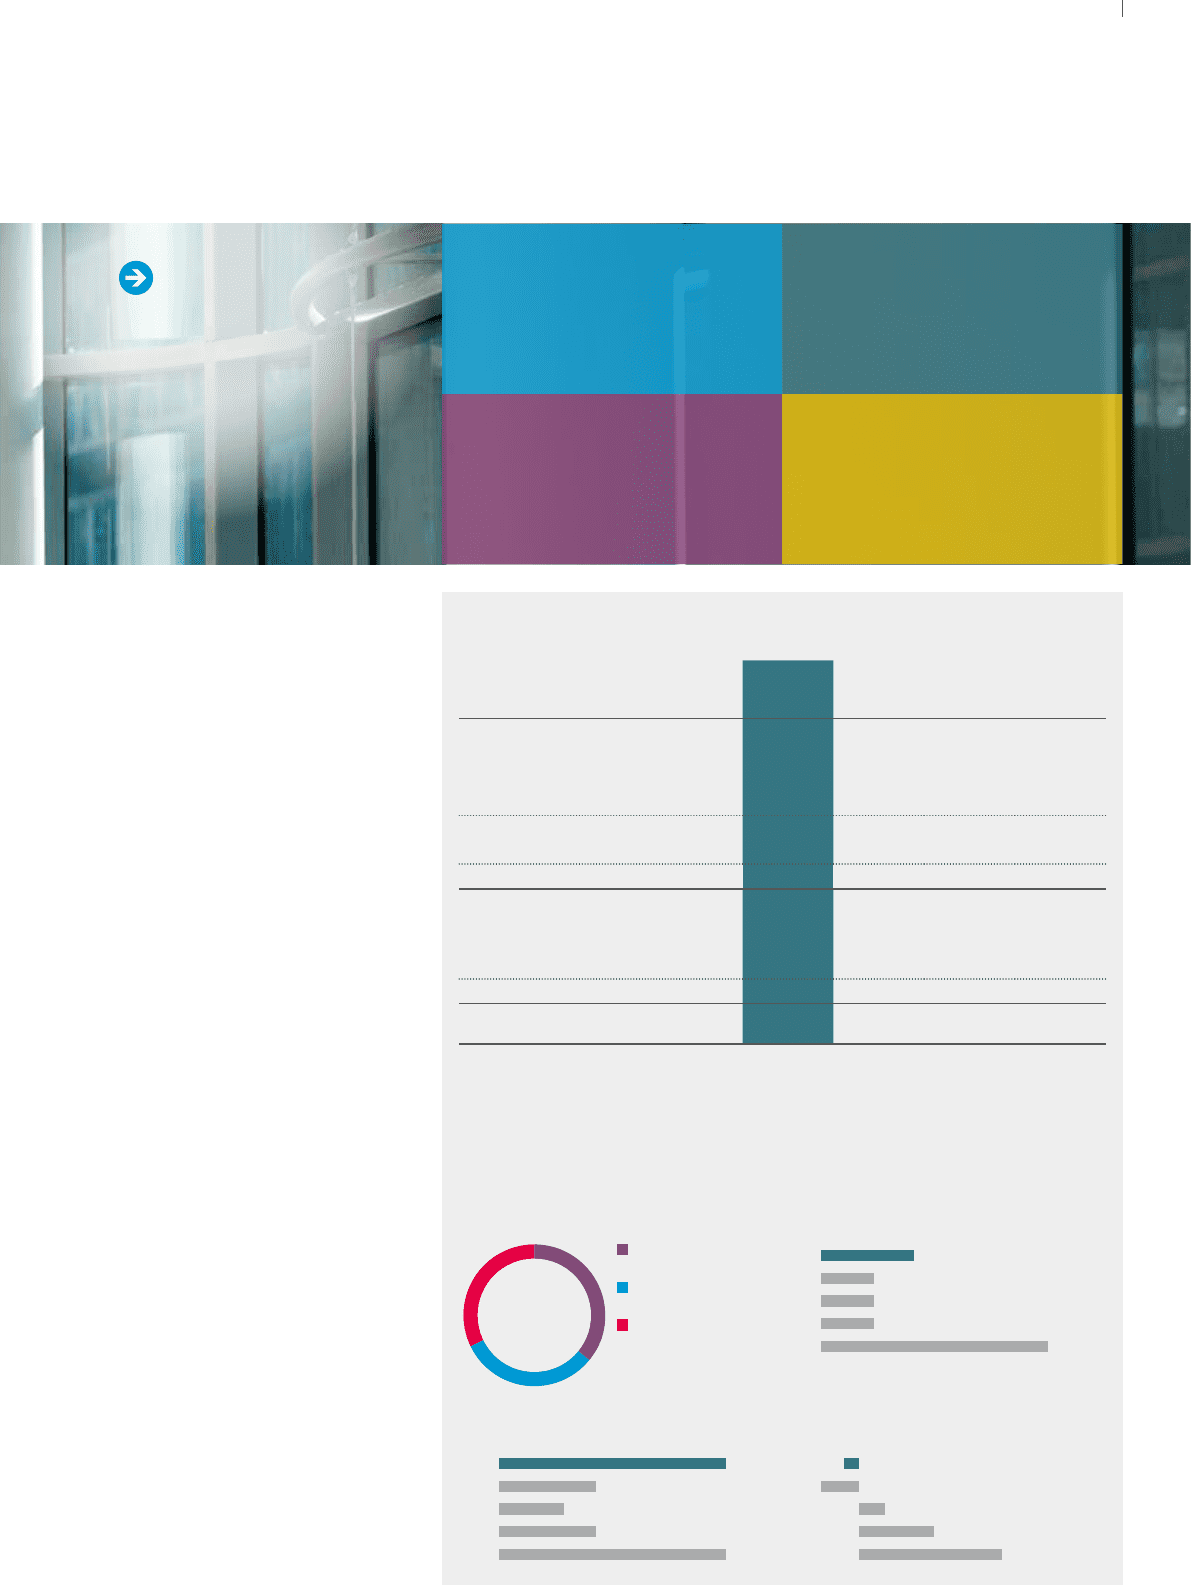
37
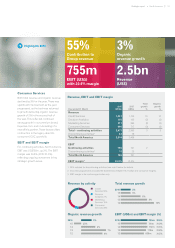
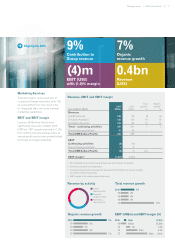
Marketing Services
Total and organic revenue growth at
constant exchange rates were both 10%
as we benefited from new client wins
for integrated data and cross-channel
marketing capabilities.
EBIT and EBIT margin
Losses in EMEA/Asia Pacific were
significantly reduced to US$4m (2015:
US$10m). EBIT margin improved to (1.0)%
from (2.3)% at actual exchange rates, as
operating efficiencies were partially offset
by foreign exchange headwinds.
Year ended 31 March
2016
US$m
20151
US$m
Total
growth2
%
Organic
growth2
%
Revenue
Credit Services 149 176 (3) (3)
Decision Analytics 135 130 18 18
Marketing Services 133 135 10 10
Total – continuing activities 417 441 7 7
Discontinuing activities315 45
Total EMEA/Asia Pacific 432 486
EBIT
Continuing activities (4) (10)
Discontinuing activities319
Total EMEA/Asia Pacific (3) (1) n/a
EBIT margin4(1.0)% (2.3)%
1 2015 restated for discontinuing activities (see note 3 below for details).
2 Growth at constant exchange rates.
3 Discontinuing activities includes the divestments of FootFall, Consumer Insights
and other smaller businesses.
4 EBIT margin is for continuing activities only.
Credit
Services 36%
Decision
Analytics 32%
Marketing
Services 32%
2%
3%
7%
7%
3%
7%
4%
4%
4%
17%
(1.0)%
1.4%
(2.3)%
4.1%
6.6%
(4)m
(10)m
7m
20m
38m
9% 7%
Contribution to
Group revenue
Organic
revenue growth
(4)m
EBIT (US$)
with (1.0)% margin
0.4bn
Revenue
(US$)
Revenue by activity Total revenue growth
Organic revenue growth EBIT (US$m) and EBIT margin (%)
2016
2016
15
15
14
14
13
13
12
12
2016
15
14
13
12
Revenue, EBIT and EBIT margin
Highlights 2016
Strategic report •EMEA/Asia Pacic