Experian 2016 Annual Report Download - page 151
Download and view the complete annual report
Please find page 151 of the 2016 Experian annual report below. You can navigate through the pages in the report by either clicking on the pages listed below, or by using the keyword search tool below to find specific information within the annual report.-
 1
1 -
2
-
3
-
4
-
5
-
6
-
7
-
8
-
9
-
10
-
11
-
12
-
13
-
14
-
15
-
16
-
17
-
18
-
19
-
20
-
21
-
22
-
23
-
24
-
25
-
26
-
27
-
28
-
29
-
30
-
31
-
32
-
33
-
34
-
35
-
36
-
37
-
38
-
39
-
40
-
41
-
42
-
43
-
44
-
45
-
46
-
47
-
48
-
49
-
50
-
51
-
52
-
53
-
54
-
55
-
56
-
57
-
58
-
59
-
60
-
61
-
62
-
63
-
64
-
65
-
66
-
67
-
68
-
69
-
70
-
71
-
72
-
73
-
74
-
75
-
76
-
77
-
78
-
79
-
80
-
81
-
82
-
83
-
84
-
85
-
86
-
87
-
88
-
89
-
90
-
91
-
92
-
93
-
94
-
95
-
96
-
97
-
98
-
99
-
100
-
101
-
102
-
103
-
104
-
105
-
106
-
107
-
108
-
109
-
110
-
111
-
112
-
113
-
114
-
115
-
116
-
117
-
118
-
119
-
120
-
121
-
122
-
123
-
124
-
125
-
126
-
127
-
128
-
129
-
130
-
131
-
132
-
133
-
134
-
135
-
136
-
137
-
138
-
139
-
140
-
 141
141 -
 142
142 -
 143
143 -
 144
144 -
 145
145 -
 146
146 -
 147
147 -
 148
148 -
 149
149 -
 150
150 -
 151
151 -
 152
152 -
 153
153 -
 154
154 -
 155
155 -
 156
156 -
 157
157 -
 158
158 -
 159
159 -
 160
160 -
 161
161 -
162
-
163
-
164
-
165
-
166
-
167
-
168
-
169
-
170
-
171
-
172
-
173
-
174
-
175
-
176
-
177
-
178
-
179
-
180
-
181
-
182
-
183
-
184
-
185
-
186
-
187
-
188
 |
 |

149•Notes to the Group nancial statementsFinancial statements
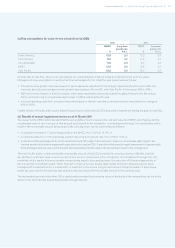
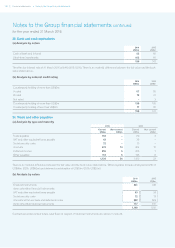
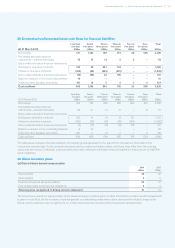
25. Borrowings
(a) Analysis by carrying amounts and fair value
Carrying amount Fair value
2016
US$m
2015
US$m
2016
US$m
2015
US$m
Current:
Bank loans –100 –100
Commercial paper 44 40 44 40
Bank overdrafts 5 25 2
Finance lease obligations 3 43 4
52 146 52 146
Non-current:
US$600m 2.375% notes 2017 603 601 601 608
£400m 4.75% Euronotes 2018 622 647 622 657
€500m 4.75% Euronotes 2020 646 617 660 640
£400m 3.50% Euronotes 2021 596 608 614 635
Bank loans 600 669 600 669
Finance lease obligations 1 41 4
3,068 3,146 3,098 3,213
Total borrowings 3,120 3,292 3,150 3,359
The effective interest rates for bonds approximate to the coupon rates indicated above. Other than finance lease obligations, the
borrowings are unsecured. Further information on the methodology used in determining fair values is given in note 28.
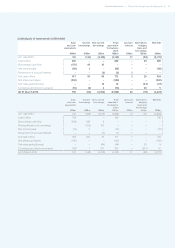
(b) Analysis by maturity
2016
US$m
2015
US$m
Less than one year 52 146
One to two years 1,104 672
Two to three years 722 602
Three to four years 646 647
Four to five years –617
Over five years 596 608
3,120 3,292
(c) Analysis by currency
2016
US$m
2015
US$m
US dollar 2,514 2,530
Sterling 443 620
Euro 100 83
Other 63 59
3,120 3,292
The above analysis takes account of the effect of cross currency swaps and forward foreign exchange contracts and reflects the way
in which the Group manages exposures.